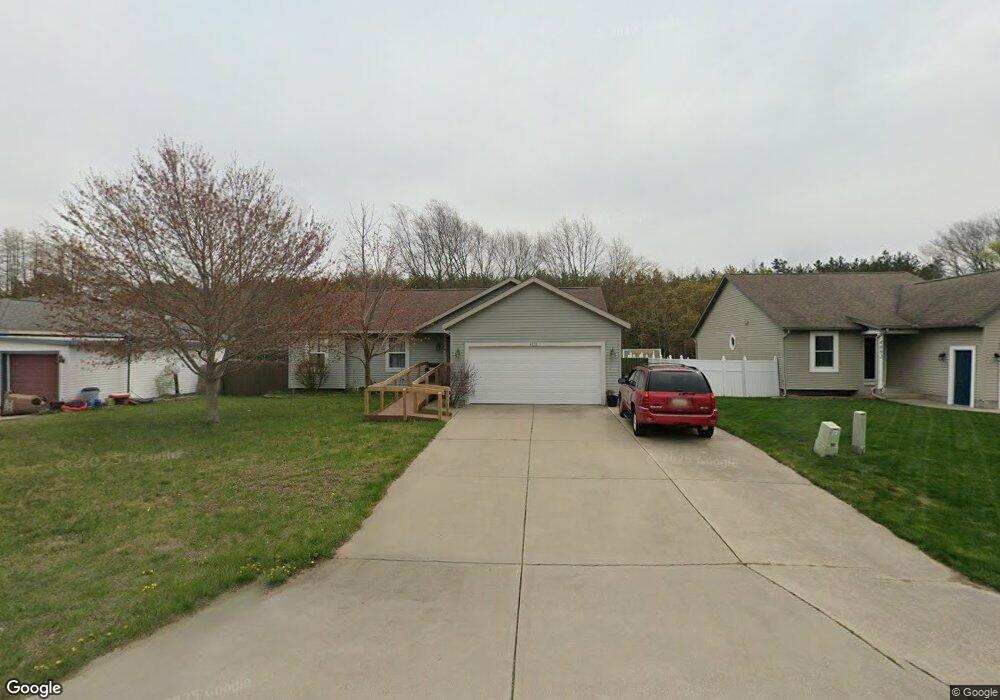
4878 Emerald St Norton Shores, MI 49441
Estimated Value: $296,000 - $336,000
3
Beds
2
Baths
1,764
Sq Ft
$179/Sq Ft
Est. Value
About This Home
This home is located at 4878 Emerald St, Norton Shores, MI 49441 and is currently estimated at $315,248, approximately $178 per square foot. 4878 Emerald St is a home located in Muskegon County with nearby schools including Mona Shores High School, Edgewood Elementary Academy, and Dr. Martin Luther King Academy.
Ownership History
Date
Name
Owned For
Owner Type
Purchase Details
Closed on
Feb 3, 2022
Sold by
Matthews-Randleel Chandra Y
Bought by
Matthews-Randleel Chandra Y
Current Estimated Value
Purchase Details
Closed on
Jan 15, 2010
Sold by
Spicer Troy and Spicer Jennifer
Bought by
Beneficial Michigan Inc
Purchase Details
Closed on
Oct 11, 2002
Sold by
Rod Horsfall Builders Inc
Bought by
Spicer Troy and Spicer Jennifer
Home Financials for this Owner
Home Financials are based on the most recent Mortgage that was taken out on this home.
Original Mortgage
$128,900
Interest Rate
6.3%
Mortgage Type
Unknown
Create a Home Valuation Report for This Property
The Home Valuation Report is an in-depth analysis detailing your home's value as well as a comparison with similar homes in the area
Home Values in the Area
Average Home Value in this Area
Purchase History
| Date | Buyer | Sale Price | Title Company |
|---|---|---|---|
| Matthews-Randleel Chandra Y | -- | None Listed On Document | |
| Beneficial Michigan Inc | $97,052 | None Available | |
| Spicer Troy | -- | Harbor Title |
Source: Public Records
Mortgage History
| Date | Status | Borrower | Loan Amount |
|---|---|---|---|
| Previous Owner | Spicer Troy | $128,900 |
Source: Public Records
Tax History Compared to Growth
Tax History
| Year | Tax Paid | Tax Assessment Tax Assessment Total Assessment is a certain percentage of the fair market value that is determined by local assessors to be the total taxable value of land and additions on the property. | Land | Improvement |
|---|---|---|---|---|
| 2025 | $2,893 | $144,400 | $0 | $0 |
| 2024 | $2,268 | $134,300 | $0 | $0 |
| 2023 | $2,166 | $119,900 | $0 | $0 |
| 2022 | $2,641 | $101,500 | $0 | $0 |
| 2021 | $2,566 | $92,600 | $0 | $0 |
| 2020 | $2,537 | $86,400 | $0 | $0 |
| 2019 | $2,490 | $79,200 | $0 | $0 |
| 2018 | $2,432 | $72,500 | $0 | $0 |
| 2017 | $2,376 | $71,800 | $0 | $0 |
| 2016 | $1,840 | $66,500 | $0 | $0 |
| 2015 | -- | $61,400 | $0 | $0 |
| 2014 | $2,207 | $61,600 | $0 | $0 |
| 2013 | -- | $59,500 | $0 | $0 |
Source: Public Records
Map
Nearby Homes
- 1283 E Ellis Rd Unit 18
- 1283 E Ellis Rd Unit 20
- 1283 E Ellis Rd Unit 19
- 1283 E Ellis Rd Unit 21
- 1404 E Ellis Rd
- 1065 Wilson Ct
- 4638 Lauren Dr
- 4535 Thompson Rd
- V/L E Ellis Rd
- 4677 Harvey St
- 1067 Aspen Dr
- 4476 Cedar Ln Unit 54
- 4769 Harvey St
- 4468 Spruce Ct
- V/L 4535 Thompson Rd
- 945 Petrie Ave
- 5365 Grand Haven Rd
- 4875 Paul Ct
- 5417 Grand Haven Rd
- 1130 Englewood Ave
- 4866 Emerald St
- 4892 Emerald St
- 0 Emerald St Unit 9914434
- 0 Emerald St Unit 9914425
- 0 Emerald St Unit 9822703
- 0 Emerald St Unit 9822699
- 0 Emerald St Unit 2108827
- 4900 Emerald St
- 4858 Emerald St
- 4887 Emerald St
- 4895 Emerald St
- 4908 Emerald St
- 4844 Emerald St
- 4859 Emerald St
- 4849 Emerald St
- 4834 Emerald St
- 4900 Grand St
- 4837 Emerald St
- 4882 Grand St
- 4872 Grand St