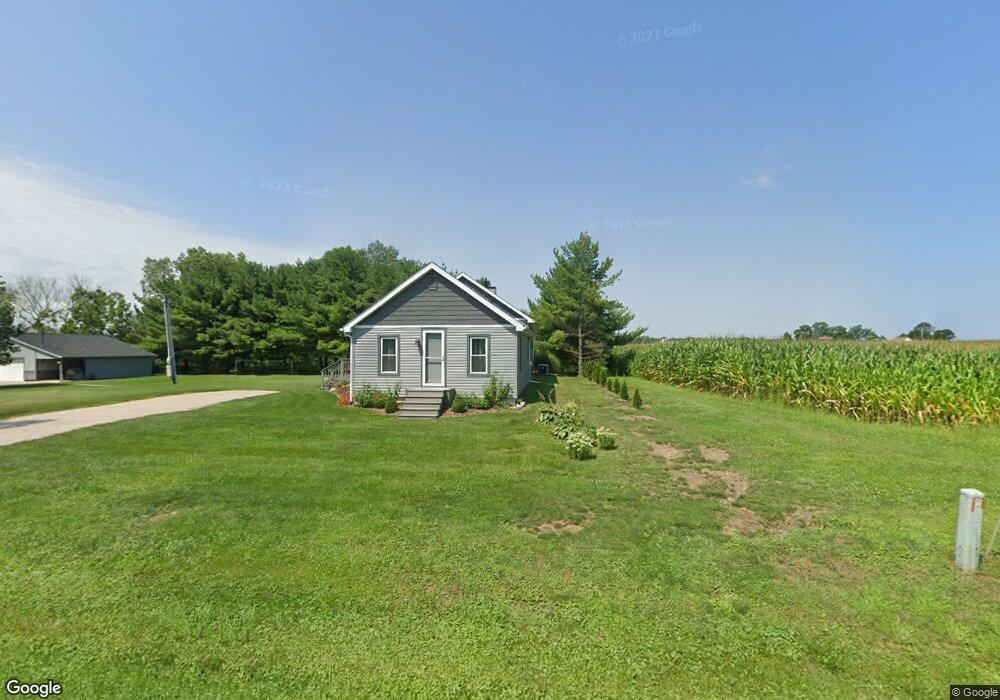
4878 Leonardsburg Rd Delaware, OH 43015
Estimated Value: $205,000 - $345,000
1
Bed
1
Bath
947
Sq Ft
$318/Sq Ft
Est. Value
About This Home
This home is located at 4878 Leonardsburg Rd, Delaware, OH 43015 and is currently estimated at $301,056, approximately $317 per square foot. 4878 Leonardsburg Rd is a home located in Delaware County with nearby schools including Buckeye Valley High School.
Ownership History
Date
Name
Owned For
Owner Type
Purchase Details
Closed on
Jan 14, 2014
Sold by
Presthus Joel H
Bought by
Presthus Joel H and Presthus Tamela S
Current Estimated Value
Home Financials for this Owner
Home Financials are based on the most recent Mortgage that was taken out on this home.
Original Mortgage
$105,483
Outstanding Balance
$28,490
Interest Rate
3.54%
Mortgage Type
New Conventional
Estimated Equity
$272,566
Purchase Details
Closed on
Mar 10, 1997
Sold by
Finks Larry R
Bought by
Presthus Joel H
Home Financials for this Owner
Home Financials are based on the most recent Mortgage that was taken out on this home.
Original Mortgage
$64,000
Interest Rate
7.25%
Mortgage Type
New Conventional
Purchase Details
Closed on
Feb 8, 1996
Sold by
Fields Thomas K
Bought by
Finks Larry R
Home Financials for this Owner
Home Financials are based on the most recent Mortgage that was taken out on this home.
Original Mortgage
$63,957
Interest Rate
7.11%
Mortgage Type
FHA
Create a Home Valuation Report for This Property
The Home Valuation Report is an in-depth analysis detailing your home's value as well as a comparison with similar homes in the area
Home Values in the Area
Average Home Value in this Area
Purchase History
| Date | Buyer | Sale Price | Title Company |
|---|---|---|---|
| Presthus Joel H | -- | None Available | |
| Presthus Joel H | $71,150 | -- | |
| Finks Larry R | $64,000 | -- |
Source: Public Records
Mortgage History
| Date | Status | Borrower | Loan Amount |
|---|---|---|---|
| Open | Presthus Joel H | $105,483 | |
| Closed | Presthus Joel H | $64,000 | |
| Previous Owner | Finks Larry R | $63,957 |
Source: Public Records
Tax History Compared to Growth
Tax History
| Year | Tax Paid | Tax Assessment Tax Assessment Total Assessment is a certain percentage of the fair market value that is determined by local assessors to be the total taxable value of land and additions on the property. | Land | Improvement |
|---|---|---|---|---|
| 2024 | $2,947 | $77,420 | $14,350 | $63,070 |
| 2023 | $2,753 | $77,420 | $14,350 | $63,070 |
| 2022 | $2,284 | $57,330 | $10,500 | $46,830 |
| 2021 | $2,286 | $57,330 | $10,500 | $46,830 |
| 2020 | $2,301 | $57,330 | $10,500 | $46,830 |
| 2019 | $2,245 | $51,310 | $8,750 | $42,560 |
| 2018 | $2,278 | $51,310 | $8,750 | $42,560 |
| 2017 | $2,125 | $47,150 | $7,000 | $40,150 |
| 2016 | $1,967 | $47,150 | $7,000 | $40,150 |
| 2015 | $2,069 | $47,150 | $7,000 | $40,150 |
| 2014 | $1,954 | $47,150 | $7,000 | $40,150 |
| 2013 | $1,975 | $47,150 | $7,000 | $40,150 |
Source: Public Records
Map
Nearby Homes
- 3900 Main St
- 8356 Ashley Rd
- 216 County Road 24
- 0 Whipple Rd Unit 225024053
- 6914 Oxford Woods Dr
- 0 Bowtown Rd
- 202 S Main St
- NA Ohio 229
- 4422 Ohio 229
- 0 W Taylor St
- 4 S Central St
- 6 W Taylor St
- Tract 6 State Route 521
- 1330 Hanover Rd
- 1330 Hanover Rd Unit 31
- 1330 Hanover Rd Unit 118
- 3030 Ohio 229
- 6239 Howard Rd
- 3030 State Route 229
- 0 Twigg Hupp Rd
- 4859 Leonardsburg Rd
- 4811 Leonardsburg Rd
- 5235 Giehl Rd
- 4972 Leonardsburg Rd
- 5303 Giehl Rd
- 5000 Leonardsburg Rd
- 5100 Leonardsburg Rd
- 5120 Leonardsburg Rd
- 5111 Leonardsburg Rd
- 5521 Giehl Rd
- 5565 Giehl Rd
- 4485 Leonardsburg Rd
- 5629 Giehl Rd
- 5800 Mccurdy Rd
- 4435 Leonardsburg Rd
- 5860 Mccurdy Rd
- 5025 Cackler Rd
- 4971 Cackler Rd
- 6200 Mccurdy Rd