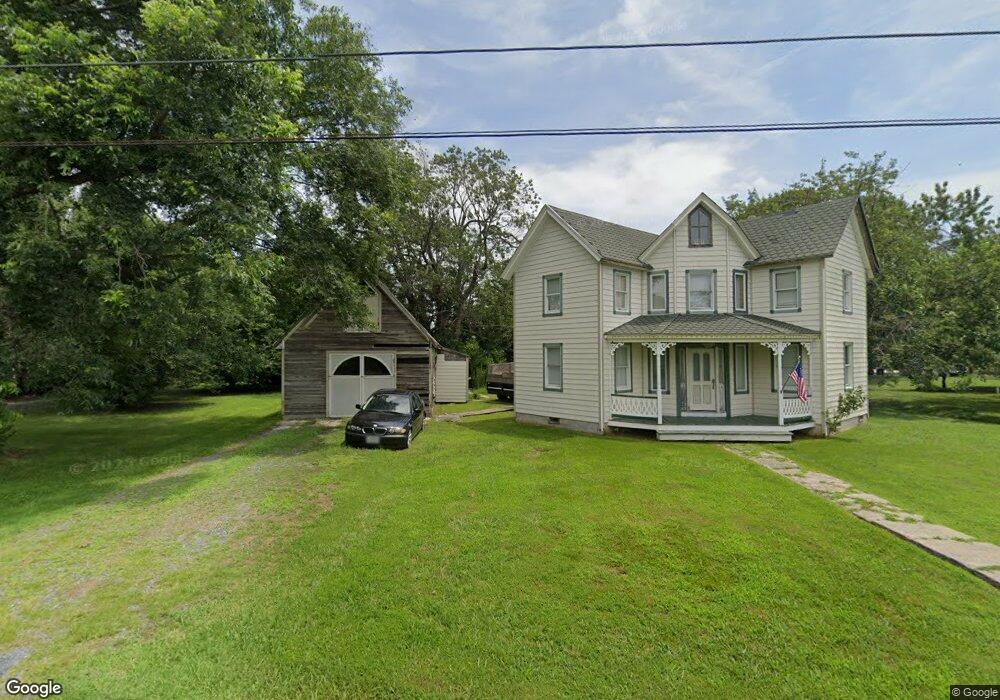
4879 Black Walnut Point Rd Tilghman, MD 21671
Estimated Value: $719,000 - $938,000
Studio
3
Baths
2,464
Sq Ft
$329/Sq Ft
Est. Value
About This Home
This home is located at 4879 Black Walnut Point Rd, Tilghman, MD 21671 and is currently estimated at $811,739, approximately $329 per square foot. 4879 Black Walnut Point Rd is a home located in Talbot County with nearby schools including Tilghman Elementary School, St. Michaels Middle/High School, and Easton High School.
Ownership History
Date
Name
Owned For
Owner Type
Purchase Details
Closed on
Nov 8, 2017
Sold by
Kussmann Gillian R and Kussmann Gillian R
Bought by
Kussmann Steven Carter and Kussmann Gillian Ruston
Current Estimated Value
Purchase Details
Closed on
Feb 15, 2000
Sold by
Risser Larry L and Risser Gillian M
Bought by
Kussman Steven C and Kussman Gillian R
Purchase Details
Closed on
Jun 20, 1986
Sold by
Diehl Martha V
Bought by
Risser Larry L and Risser Gillian M
Home Financials for this Owner
Home Financials are based on the most recent Mortgage that was taken out on this home.
Original Mortgage
$62,400
Interest Rate
10.61%
Purchase Details
Closed on
Dec 12, 1984
Sold by
Sperl Raymond E
Bought by
Diehl Martha
Home Financials for this Owner
Home Financials are based on the most recent Mortgage that was taken out on this home.
Original Mortgage
$66,500
Interest Rate
13.2%
Create a Home Valuation Report for This Property
The Home Valuation Report is an in-depth analysis detailing your home's value as well as a comparison with similar homes in the area
Home Values in the Area
Average Home Value in this Area
Purchase History
| Date | Buyer | Sale Price | Title Company |
|---|---|---|---|
| Kussmann Steven Carter | -- | None Available | |
| Kussman Steven C | $240,000 | -- | |
| Risser Larry L | $78,000 | -- | |
| Diehl Martha | $70,000 | -- |
Source: Public Records
Mortgage History
| Date | Status | Borrower | Loan Amount |
|---|---|---|---|
| Previous Owner | Risser Larry L | $62,400 | |
| Previous Owner | Diehl Martha | $66,500 |
Source: Public Records
Tax History
| Year | Tax Paid | Tax Assessment Tax Assessment Total Assessment is a certain percentage of the fair market value that is determined by local assessors to be the total taxable value of land and additions on the property. | Land | Improvement |
|---|---|---|---|---|
| 2025 | $5,219 | $568,700 | $172,400 | $396,300 |
| 2024 | $4,915 | $542,367 | $0 | $0 |
| 2023 | $4,414 | $516,033 | $0 | $0 |
| 2022 | $3,915 | $489,700 | $172,400 | $317,300 |
| 2021 | $7,665 | $487,267 | $0 | $0 |
| 2020 | $3,661 | $484,833 | $0 | $0 |
| 2019 | $3,643 | $482,400 | $172,200 | $310,200 |
| 2018 | $3,495 | $482,400 | $172,200 | $310,200 |
| 2017 | $3,269 | $482,400 | $0 | $0 |
| 2016 | $3,189 | $486,900 | $0 | $0 |
| 2015 | $3,050 | $486,900 | $0 | $0 |
| 2014 | $3,050 | $486,900 | $0 | $0 |
Source: Public Records
Map
Nearby Homes
- 0 Bar Neck Rd Unit MDTA2012008
- 4957 Bar Neck Rd
- 5520 Leeward Ln
- 5582 Trafalgar Cir
- 5559 Trafalgar Cir
- 5654 Trafalgar Cir
- 5648 Trafalgar Cir
- 21485 Island Club Rd
- 21477 Island Club Rd
- 5933 Tilghman Island Rd
- 21486 Mission Rd
- 6050 Sunset Ln
- 21572 Chicken Point Rd
- 21560 Chicken Point Rd
- 21552 Chicken Point Rd
- 21524 Chicken Point Rd
- 21472 Willey Rd
- 21384 Coopertown Rd
- 21749 Camper Cir
- 6670 Tilghman Island Rd
- 4883 Black Walnut Point Rd
- 4873 Black Walnut Point Rd
- 4889 Black Walnut Point Rd
- 4926 Black Walnut Point Rd
- 4911 Black Walnut Point Rd
- 4849 Black Walnut Point Rd
- 4933 Black Walnut Point Rd
- 4938 Fairbank Rd
- 4807 Black Walnut Point Rd
- 4930 Black Walnut Point Rd
- 4799 Black Walnut Point Rd
- 4944 Fairbank Rd
- 4934 Fairbank Rd
- 4958 Black Walnut Point Rd
- 4940 Fairbank Rd
- 4787 Black Walnut Point Rd
- 4936 Fairbank Rd
- 21364 Fairbank Cir
- 4962 Black Walnut Point Rd
Your Personal Tour Guide
Ask me questions while you tour the home.