Estimated Value: $501,000 - $527,000
5
Beds
3
Baths
2,464
Sq Ft
$210/Sq Ft
Est. Value
About This Home
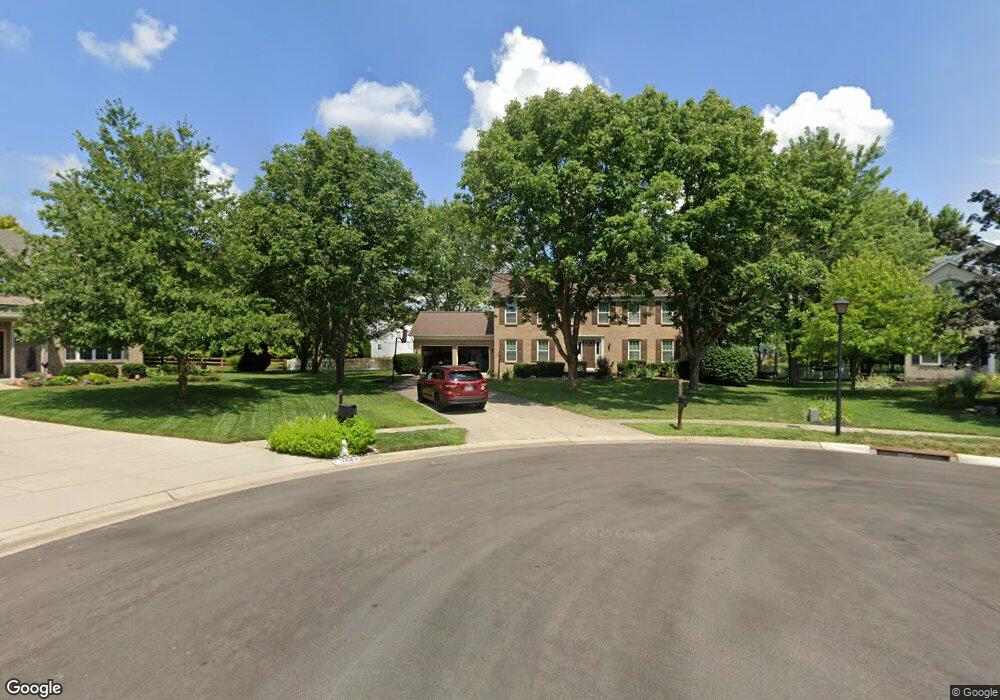
This home is located at 4879 Elizabeth Ct, Mason, OH 45040 and is currently estimated at $517,094, approximately $209 per square foot. 4879 Elizabeth Ct is a home located in Warren County with nearby schools including Mason Intermediate Elementary School, Mason Middle School, and William Mason High School.
Ownership History
Date
Name
Owned For
Owner Type
Purchase Details
Closed on
Aug 23, 2000
Sold by
Goldsmith Mark E
Bought by
Bloebaum Robert J and Bloebaum Julianne
Current Estimated Value
Home Financials for this Owner
Home Financials are based on the most recent Mortgage that was taken out on this home.
Original Mortgage
$140,000
Outstanding Balance
$50,404
Interest Rate
8.12%
Mortgage Type
New Conventional
Estimated Equity
$466,690
Purchase Details
Closed on
Aug 1, 1996
Sold by
Gardner A R
Bought by
Goldsmith Mark E and Goldsmith B
Home Financials for this Owner
Home Financials are based on the most recent Mortgage that was taken out on this home.
Original Mortgage
$159,600
Interest Rate
7.88%
Mortgage Type
New Conventional
Purchase Details
Closed on
Mar 15, 1995
Sold by
Ryland Group Inc
Bought by
Gardner Gardner A and Gardner L
Home Financials for this Owner
Home Financials are based on the most recent Mortgage that was taken out on this home.
Original Mortgage
$128,400
Interest Rate
8.97%
Mortgage Type
New Conventional
Create a Home Valuation Report for This Property
The Home Valuation Report is an in-depth analysis detailing your home's value as well as a comparison with similar homes in the area
Home Values in the Area
Average Home Value in this Area
Purchase History
| Date | Buyer | Sale Price | Title Company |
|---|---|---|---|
| Bloebaum Robert J | $186,000 | -- | |
| Goldsmith Mark E | $168,000 | -- | |
| Gardner Gardner A | $160,500 | -- |
Source: Public Records
Mortgage History
| Date | Status | Borrower | Loan Amount |
|---|---|---|---|
| Open | Bloebaum Robert J | $140,000 | |
| Previous Owner | Goldsmith Mark E | $159,600 | |
| Previous Owner | Gardner Gardner A | $128,400 |
Source: Public Records
Tax History Compared to Growth
Tax History
| Year | Tax Paid | Tax Assessment Tax Assessment Total Assessment is a certain percentage of the fair market value that is determined by local assessors to be the total taxable value of land and additions on the property. | Land | Improvement |
|---|---|---|---|---|
| 2024 | $5,033 | $124,010 | $35,000 | $89,010 |
| 2023 | $4,634 | $96,460 | $20,650 | $75,810 |
| 2022 | $4,574 | $96,460 | $20,650 | $75,810 |
| 2021 | $4,333 | $96,460 | $20,650 | $75,810 |
| 2020 | $4,283 | $81,746 | $17,500 | $64,246 |
| 2019 | $3,938 | $81,746 | $17,500 | $64,246 |
| 2018 | $3,951 | $81,746 | $17,500 | $64,246 |
| 2017 | $3,615 | $69,832 | $15,824 | $54,009 |
| 2016 | $3,723 | $69,832 | $15,824 | $54,009 |
| 2015 | $3,731 | $69,832 | $15,824 | $54,009 |
| 2014 | $3,573 | $62,350 | $14,130 | $48,220 |
| 2013 | $3,581 | $77,220 | $17,500 | $59,720 |
Source: Public Records
Map
Nearby Homes
- 4821 Bordeaux Ln Unit 4821
- 4734 Margaret Ct
- 4874 Shagbark Ct
- 5662 Hawthorn Ct
- 5239 Concord Crossing Dr
- 4521 Springhouse Ct
- 5065 Birchwood Farms Dr
- 5130 Franklin Park St
- 4643 Court Yard Dr Unit 64
- 4684 Court Yard Dr
- 4484 Pond Meadows Ct
- 5864 Grazing Ct
- 0 Mason Montgomery Rd Unit 944480
- 0 Mason Montgomery Rd Unit 1856522
- 0 Mason Montgomery Rd Unit 1846782
- 216 Short St
- 5088 Harvestdale Dr
- Vanderburgh Plan at Ivy Lane
- Belleville Plan at Ivy Lane
- Buchanan Plan at Ivy Lane
- 4843 Angeline
- 4883 Elizabeth Ct
- 4886 Elizabeth Ct
- 4839 Angeline
- 4840 Angeline
- 4895 Elizabeth Ct
- 4894 Elizabeth Ct
- 4653 Sarah Dr
- 4661 Sarah Dr
- 4869 Sarah Dr
- 4879 Sarah Dr
- 4827 Angeline
- 4914 Elizabeth Ct
- 4826 Angeline
- 4857 Sarah Dr
- 4915 Elizabeth Ct
- 4889 Sarah Dr
- 4643 Sarah Dr
- 4673 Sarah Dr
- 4847 Sarah Dr