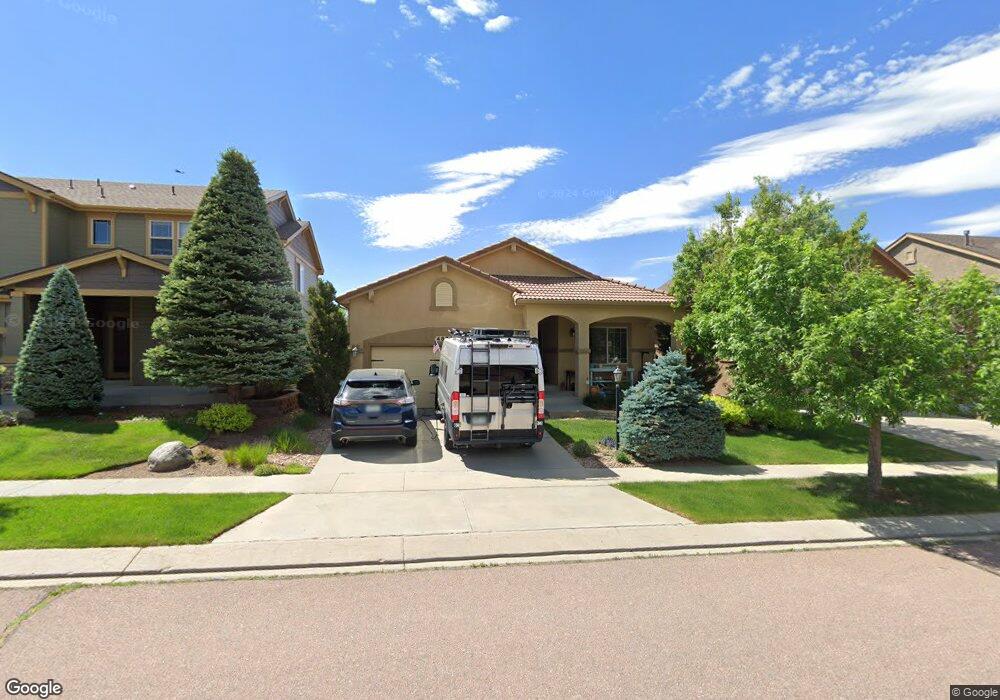
4879 Preachers Hollow Trail Colorado Springs, CO 80924
Wolf Ranch NeighborhoodEstimated Value: $647,421 - $784,000
3
Beds
3
Baths
1,619
Sq Ft
$428/Sq Ft
Est. Value
About This Home
This home is located at 4879 Preachers Hollow Trail, Colorado Springs, CO 80924 and is currently estimated at $692,355, approximately $427 per square foot. 4879 Preachers Hollow Trail is a home located in El Paso County with nearby schools including Chinook Trail Elementary School, Challenger Middle School, and Pine Creek High School.
Ownership History
Date
Name
Owned For
Owner Type
Purchase Details
Closed on
Jan 28, 2011
Sold by
Ayers Mark H and Ayers Julie M
Bought by
Ayers Mark H
Current Estimated Value
Home Financials for this Owner
Home Financials are based on the most recent Mortgage that was taken out on this home.
Original Mortgage
$321,468
Outstanding Balance
$220,077
Interest Rate
4.79%
Mortgage Type
New Conventional
Estimated Equity
$472,278
Purchase Details
Closed on
Feb 5, 2008
Sold by
Vantage Homes Corp
Bought by
Ayers Mark H and Ayers Julie M
Home Financials for this Owner
Home Financials are based on the most recent Mortgage that was taken out on this home.
Original Mortgage
$331,180
Interest Rate
6.07%
Mortgage Type
Unknown
Purchase Details
Closed on
Aug 15, 2007
Sold by
Lp47 Llc
Bought by
Vantage Homes Corp
Create a Home Valuation Report for This Property
The Home Valuation Report is an in-depth analysis detailing your home's value as well as a comparison with similar homes in the area
Home Values in the Area
Average Home Value in this Area
Purchase History
| Date | Buyer | Sale Price | Title Company |
|---|---|---|---|
| Ayers Mark H | -- | First American | |
| Ayers Mark H | $414,000 | Land Title Guarantee Company | |
| Vantage Homes Corp | $294,100 | Land Title Guarantee Company |
Source: Public Records
Mortgage History
| Date | Status | Borrower | Loan Amount |
|---|---|---|---|
| Open | Ayers Mark H | $321,468 | |
| Closed | Ayers Mark H | $331,180 |
Source: Public Records
Tax History Compared to Growth
Tax History
| Year | Tax Paid | Tax Assessment Tax Assessment Total Assessment is a certain percentage of the fair market value that is determined by local assessors to be the total taxable value of land and additions on the property. | Land | Improvement |
|---|---|---|---|---|
| 2025 | $2,445 | $46,810 | -- | -- |
| 2024 | $2,423 | $44,540 | $8,040 | $36,500 |
| 2022 | $2,162 | $32,670 | $7,390 | $25,280 |
| 2021 | $2,553 | $33,610 | $7,600 | $26,010 |
| 2020 | $2,767 | $31,090 | $6,610 | $24,480 |
| 2019 | $2,741 | $31,090 | $6,610 | $24,480 |
| 2018 | $2,576 | $28,780 | $4,900 | $23,880 |
| 2017 | $2,568 | $28,780 | $4,900 | $23,880 |
| 2016 | $2,673 | $29,930 | $5,330 | $24,600 |
| 2015 | $2,669 | $33,000 | $5,330 | $27,670 |
| 2014 | $2,752 | $30,840 | $5,090 | $25,750 |
Source: Public Records
Map
Nearby Homes
- 4895 Preachers Hollow Trail
- 5071 Farris Creek Ct
- 5019 Petrified Forest Trail
- 4837 Turquoise Lake Ct
- 6538 Arabesque Loop
- 6579 Arabesque Loop
- 5218 Eldorado Canyon Ct
- 5420 Paddington Creek Place
- 9912 San Luis Park Ct
- 5480 Leon Young Dr
- 4901 Rainbow Gulch Trail
- 4658 Kashmire Dr
- The Denali Plan at The Townes at Cumbre Vista
- The Elbrus Plan at The Townes at Cumbre Vista
- The Vinson Plan at The Townes at Cumbre Vista
- The Everest Plan at The Townes at Cumbre Vista
- 4652 Kashmire Dr
- 5359 Mount Cutler Ct
- 4545 Bays Water Dr
- 9247 Prairie Clover Dr
- 4887 Preachers Hollow Trail
- 4871 Preachers Hollow Trail
- 4863 Preachers Hollow Trail
- 4855 Preachers Hollow Trail
- 4878 Preachers Hollow Trail
- 4870 Preachers Hollow Trail
- 4886 Preachers Hollow Trail
- 4862 Preachers Hollow Trail
- 4894 Preachers Hollow Trail
- 4847 Preachers Hollow Trail
- 4984 Mushroom Rock Ct
- 4854 Preachers Hollow Trail
- 4974 Mushroom Rock Ct
- 4964 Mushroom Rock Ct
- 4839 Preachers Hollow Trail
- 4994 Mushroom Rock Ct
- 4846 Preachers Hollow Trail
- 4954 Mushroom Rock Ct
- 4869 Young Gulch Way
- 4885 Young Gulch Way