Estimated Value: $393,000 - $478,000
5
Beds
4
Baths
3,166
Sq Ft
$142/Sq Ft
Est. Value
About This Home
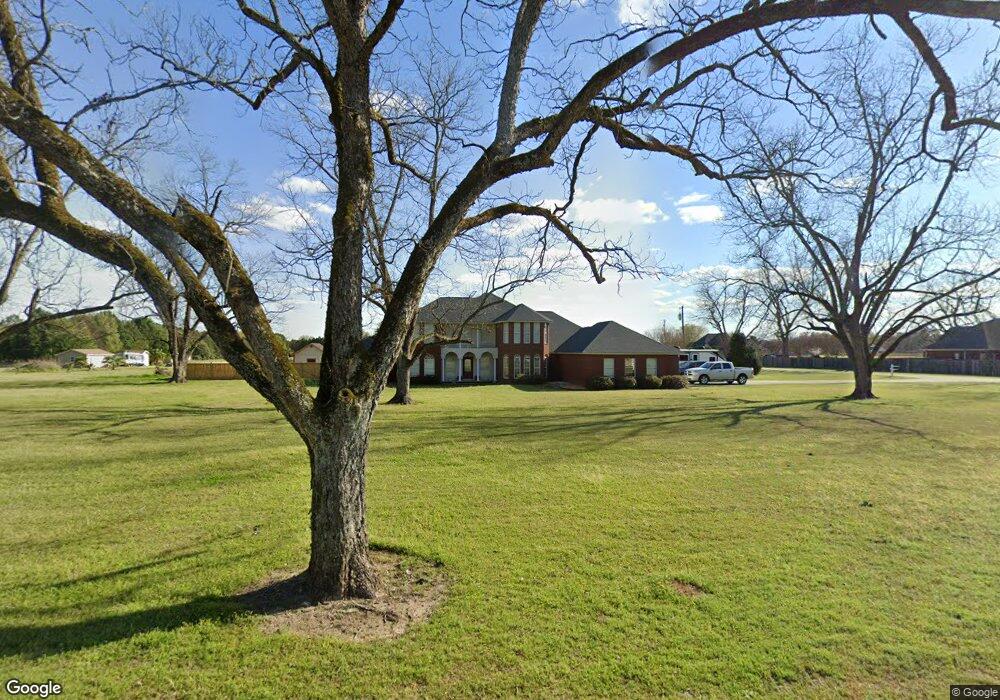
This home is located at 488 Courtney Dr, Byron, GA 31008 and is currently estimated at $448,993, approximately $141 per square foot. 488 Courtney Dr is a home located in Peach County with nearby schools including Byron Elementary School, Byron Middle School, and Peach County High School.
Ownership History
Date
Name
Owned For
Owner Type
Purchase Details
Closed on
Sep 15, 2011
Sold by
Springleaf Financial Services Inc
Bought by
Slangal Charles D and Slangal Danita G
Current Estimated Value
Home Financials for this Owner
Home Financials are based on the most recent Mortgage that was taken out on this home.
Original Mortgage
$219,500
Outstanding Balance
$147,965
Interest Rate
4.24%
Mortgage Type
VA
Estimated Equity
$301,028
Purchase Details
Closed on
Aug 3, 2010
Sold by
Blando Brian Paul
Bought by
American General Financial Services Inc
Purchase Details
Closed on
Jun 30, 2000
Sold by
Blando Cindy
Bought by
Blando Brian
Purchase Details
Closed on
Jul 19, 1999
Sold by
Land South Investmen
Bought by
Blando Brian and Blando Cindy
Purchase Details
Closed on
Nov 24, 1997
Bought by
Land South Investments Inc
Create a Home Valuation Report for This Property
The Home Valuation Report is an in-depth analysis detailing your home's value as well as a comparison with similar homes in the area
Home Values in the Area
Average Home Value in this Area
Purchase History
We collect this data history from publicly available records. To have your information removed, we recommend requesting removal directly through your county’s website.
| Date | Buyer | Sale Price | Title Company |
|---|---|---|---|
| Slangal Charles D | $219,500 | -- | |
| American General Financial Services Inc | $260,000 | -- | |
| Blando Brian | -- | -- | |
| Blando Brian | $22,000 | -- | |
| Land South Investments Inc | -- | -- |
Source: Public Records
Mortgage History
We collect this data history from publicly available records. To have your information removed, we recommend requesting removal directly through your county’s website.
| Date | Status | Borrower | Loan Amount |
|---|---|---|---|
| Open | Slangal Charles D | $219,500 |
Source: Public Records
Tax History
| Year | Tax Paid | Tax Assessment Tax Assessment Total Assessment is a certain percentage of the fair market value that is determined by local assessors to be the total taxable value of land and additions on the property. | Land | Improvement |
|---|---|---|---|---|
| 2025 | $3,900 | $159,960 | $21,320 | $138,640 |
| 2024 | $4,015 | $144,800 | $21,000 | $123,800 |
| 2023 | $4,022 | $143,840 | $16,800 | $127,040 |
| 2022 | $3,570 | $127,040 | $16,800 | $110,240 |
| 2021 | $3,497 | $107,480 | $16,800 | $90,680 |
| 2020 | $3,459 | $106,240 | $16,800 | $89,440 |
| 2019 | $3,475 | $106,240 | $16,800 | $89,440 |
| 2018 | $3,491 | $106,240 | $16,800 | $89,440 |
| 2017 | $3,507 | $106,240 | $16,800 | $89,440 |
| 2016 | $3,493 | $106,240 | $16,800 | $89,440 |
| 2015 | $3,499 | $106,240 | $16,800 | $89,440 |
| 2014 | $3,504 | $106,240 | $16,800 | $89,440 |
| 2013 | -- | $106,240 | $16,800 | $89,440 |
Source: Public Records
Map
Nearby Homes
- 454 Eli Way Dr
- 306 Southgate Dr
- 303 Southgate Dr Unit LOT D63
- 306 Southgate Dr Unit LOT D61
- 304 Southgate Dr
- 232 Shantz Way Unit LOT A33
- 223 Shantz Way
- 223 Shantz Way Unit LOT D10
- 236 Shantz Way Unit LOT A35
- 232 Shantz Way
- 300 Southgate Dr Unit LOT D58
- 103 Park Bench Way Unit LOT D79
- 300 Southgate Dr
- 304 Southgate Dr Unit LOT D60
- 234 Shantz Way Unit (LOT A34)
- 303 Southgate Dr
- 589 Burnett Rd
- 0 Highway 42 Unit 10576098
- 0 Hwy 247 Connector Unit 10716329
- 350 Georgia 42
- 430 Courtney Dr
- 1196 Ga Highway 42
- 1216 Ga Highway 42
- 1242 Ga Highway 42
- 28 Eli Way Dr
- 384 Courtney Dr
- 1097 Ga Highway 42
- 1097 Ga Highway 42
- 1097 Ga Highway 42
- 31 Eli Way Dr
- 1272 Ga Highway 42
- 64 Eli Way Dr
- 79 Giles Rd
- 364 Courtney Dr
- 1278 Ga Highway 42
- 1278 Ga Highway 42
- 1278 Ga Highway 42
- 1049 Georgia 42
- 88 Eli Way Dr
- 111 Eli Way Dr
Your Personal Tour Guide
Ask me questions while you tour the home.