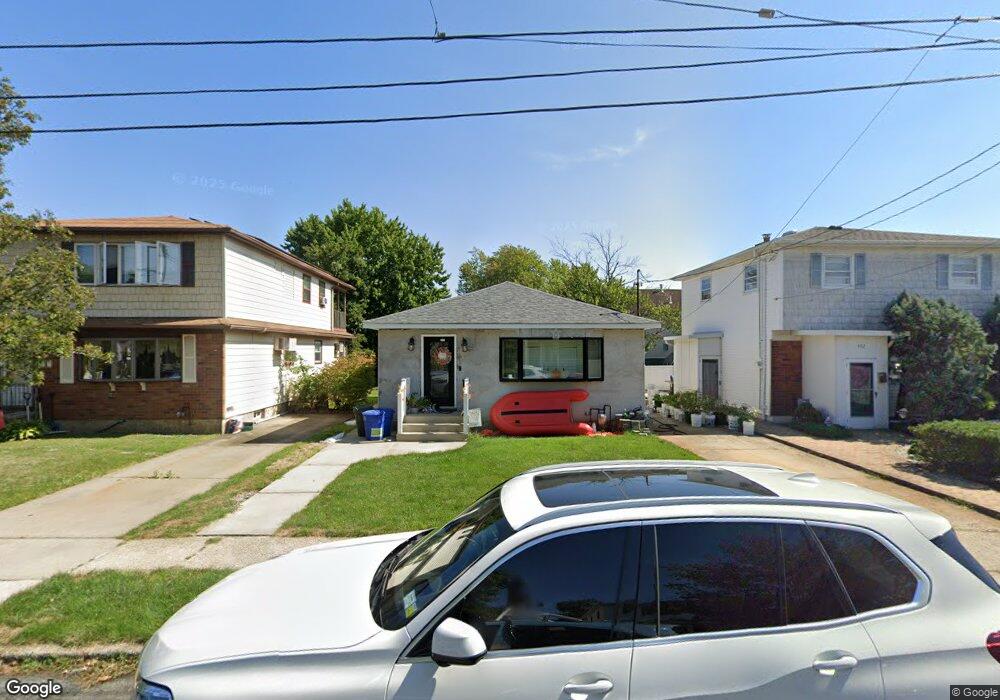
488 Flint St Staten Island, NY 10306
Oakwood NeighborhoodEstimated Value: $610,000 - $780,000
--
Bed
4
Baths
1,100
Sq Ft
$633/Sq Ft
Est. Value
About This Home
This home is located at 488 Flint St, Staten Island, NY 10306 and is currently estimated at $696,243, approximately $632 per square foot. 488 Flint St is a home located in Richmond County with nearby schools including P.S. 50 Frank Hankinson School, Myra S. Barnes Intermediate School 24, and New Dorp High School.
Ownership History
Date
Name
Owned For
Owner Type
Purchase Details
Closed on
Mar 15, 2018
Sold by
Guidotti Lisa
Bought by
Schembari Vincent and Alcudia Blanca
Current Estimated Value
Home Financials for this Owner
Home Financials are based on the most recent Mortgage that was taken out on this home.
Original Mortgage
$431,519
Outstanding Balance
$372,959
Interest Rate
4.75%
Mortgage Type
FHA
Estimated Equity
$323,284
Create a Home Valuation Report for This Property
The Home Valuation Report is an in-depth analysis detailing your home's value as well as a comparison with similar homes in the area
Home Values in the Area
Average Home Value in this Area
Purchase History
| Date | Buyer | Sale Price | Title Company |
|---|---|---|---|
| Schembari Vincent | $440,000 | None Available |
Source: Public Records
Mortgage History
| Date | Status | Borrower | Loan Amount |
|---|---|---|---|
| Open | Schembari Vincent | $431,519 |
Source: Public Records
Tax History Compared to Growth
Tax History
| Year | Tax Paid | Tax Assessment Tax Assessment Total Assessment is a certain percentage of the fair market value that is determined by local assessors to be the total taxable value of land and additions on the property. | Land | Improvement |
|---|---|---|---|---|
| 2025 | $6,438 | $42,720 | $9,368 | $33,352 |
| 2024 | $4,478 | $35,820 | $10,738 | $25,082 |
| 2023 | $4,181 | $30,240 | $9,276 | $20,964 |
| 2022 | $4,077 | $33,960 | $12,000 | $21,960 |
| 2021 | $6,200 | $33,300 | $12,000 | $21,300 |
| 2020 | $5,883 | $34,200 | $12,000 | $22,200 |
| 2019 | $5,588 | $34,980 | $12,000 | $22,980 |
| 2018 | $5,137 | $25,200 | $12,000 | $13,200 |
| 2017 | $5,005 | $26,021 | $10,819 | $15,202 |
| 2016 | $4,598 | $24,549 | $11,261 | $13,288 |
| 2015 | $4,140 | $23,160 | $10,020 | $13,140 |
| 2014 | $4,140 | $23,160 | $10,020 | $13,140 |
Source: Public Records
Map
Nearby Homes