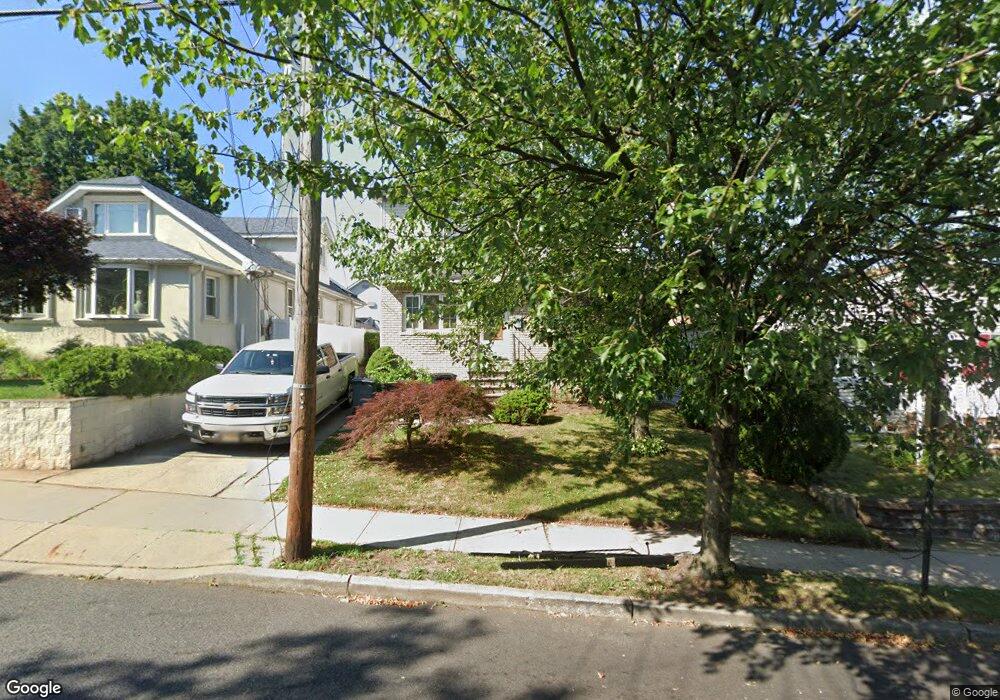
488 Harding Ave Lyndhurst, NJ 07071
Estimated Value: $644,087 - $745,000
4
Beds
4
Baths
1,942
Sq Ft
$355/Sq Ft
Est. Value
About This Home
This home is located at 488 Harding Ave, Lyndhurst, NJ 07071 and is currently estimated at $689,772, approximately $355 per square foot. 488 Harding Ave is a home located in Bergen County with nearby schools including Lyndhurst High School and Sacred Heart School.
Ownership History
Date
Name
Owned For
Owner Type
Purchase Details
Closed on
Aug 21, 2002
Current Estimated Value
Purchase Details
Closed on
Dec 27, 2001
Sold by
Patrao Antonio
Bought by
Desai Dipen
Home Financials for this Owner
Home Financials are based on the most recent Mortgage that was taken out on this home.
Original Mortgage
$275,000
Interest Rate
7.15%
Purchase Details
Closed on
Oct 23, 1998
Sold by
Lasiewski John S
Bought by
Patrao Antonio and Patrao Licinia
Create a Home Valuation Report for This Property
The Home Valuation Report is an in-depth analysis detailing your home's value as well as a comparison with similar homes in the area
Home Values in the Area
Average Home Value in this Area
Purchase History
| Date | Buyer | Sale Price | Title Company |
|---|---|---|---|
| -- | -- | -- | |
| Desai Dipen | $399,000 | -- | |
| Patrao Antonio | $135,000 | -- |
Source: Public Records
Mortgage History
| Date | Status | Borrower | Loan Amount |
|---|---|---|---|
| Previous Owner | Desai Dipen | $275,000 |
Source: Public Records
Tax History
| Year | Tax Paid | Tax Assessment Tax Assessment Total Assessment is a certain percentage of the fair market value that is determined by local assessors to be the total taxable value of land and additions on the property. | Land | Improvement |
|---|---|---|---|---|
| 2025 | $10,793 | $522,800 | $266,600 | $256,200 |
| 2024 | $10,304 | $517,400 | $264,100 | $253,300 |
| 2023 | $10,842 | $507,100 | $256,600 | $250,500 |
| 2022 | $10,842 | $341,800 | $159,200 | $182,600 |
| 2021 | $10,391 | $341,800 | $159,200 | $182,600 |
| 2020 | $10,165 | $341,800 | $159,200 | $182,600 |
| 2019 | $10,090 | $341,800 | $159,200 | $182,600 |
| 2018 | $10,172 | $341,800 | $159,200 | $182,600 |
| 2017 | $9,916 | $341,800 | $159,200 | $182,600 |
| 2016 | $9,693 | $341,800 | $159,200 | $182,600 |
| 2015 | $9,389 | $341,800 | $159,200 | $182,600 |
| 2014 | $9,266 | $341,800 | $159,200 | $182,600 |
Source: Public Records
Map
Nearby Homes
- 471 Harding Ave
- 105 Jauncey Ave
- 609 Chase Ave
- 752 Ridge Rd
- 715 Tyler St
- 20 Bergen Ave
- 825 Riverside Ave Unit 204
- 715 Stuyvesant Ave
- 712 Meyer Ave
- 521 Weart Ave
- 619 Lewandowski St
- 433 Chase Ave
- 75 Birchwood Dr
- 734 Louise Ct
- 184 Albert St
- 230 New St
- 2 Eckhardt Terrace
- 119 Crystal St
- 200 Page Ave
- 623 Schuyler Ave Unit 302
- 492 Harding Ave
- 484 Harding Ave
- 496 Harding Ave
- 480 Harding Ave
- 475 Roosevelt Ave
- 471 Roosevelt Ave
- 477 Roosevelt Ave
- 500 Harding Ave
- 476 Harding Ave
- 467 Roosevelt Ave
- 481 Roosevelt Ave
- 501 Harding Ave
- 495 Harding Ave
- 463 Roosevelt Ave
- 502 Harding Ave
- 505 Harding Ave
- 483 Roosevelt Ave
- 472 Harding Ave
- 491 Harding Ave
- 507 Harding Ave
Your Personal Tour Guide
Ask me questions while you tour the home.