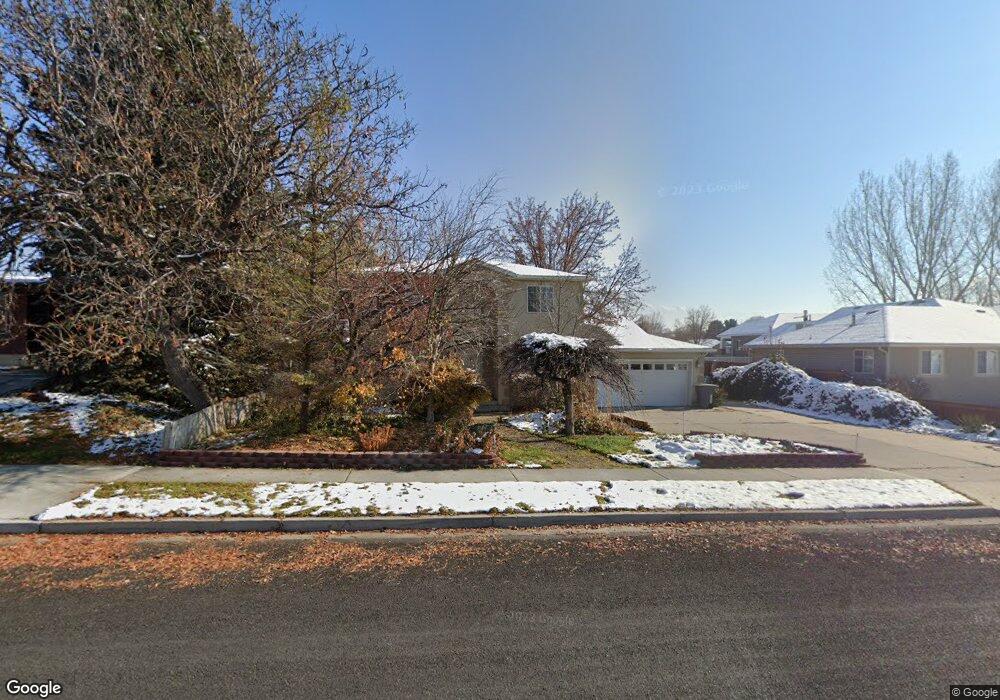
488 N 400 W American Fork, UT 84003
Estimated Value: $836,000 - $867,000
7
Beds
6
Baths
3,955
Sq Ft
$217/Sq Ft
Est. Value
About This Home
This home is located at 488 N 400 W, American Fork, UT 84003 and is currently estimated at $856,507, approximately $216 per square foot. 488 N 400 W is a home located in Utah County with nearby schools including Shelley Elementary School, American Fork Junior High School, and American Fork High School.
Ownership History
Date
Name
Owned For
Owner Type
Purchase Details
Closed on
Aug 31, 2006
Sold by
Rehling Brian M
Bought by
Long Db and Long Sandra
Current Estimated Value
Home Financials for this Owner
Home Financials are based on the most recent Mortgage that was taken out on this home.
Original Mortgage
$220,000
Outstanding Balance
$132,765
Interest Rate
6.76%
Mortgage Type
Purchase Money Mortgage
Estimated Equity
$723,742
Purchase Details
Closed on
Nov 12, 2004
Sold by
Sowby Michael S and Sowby Tiffany A
Bought by
Rehling Brian M
Purchase Details
Closed on
Nov 7, 1997
Sold by
Sowby Michael S
Bought by
Sowby Michael S and Sowby Tiffany A
Home Financials for this Owner
Home Financials are based on the most recent Mortgage that was taken out on this home.
Original Mortgage
$83,000
Interest Rate
7.3%
Create a Home Valuation Report for This Property
The Home Valuation Report is an in-depth analysis detailing your home's value as well as a comparison with similar homes in the area
Home Values in the Area
Average Home Value in this Area
Purchase History
| Date | Buyer | Sale Price | Title Company |
|---|---|---|---|
| Long Db | -- | First Southwestern Title Ag | |
| Rehling Brian M | -- | First American Title Agency | |
| Sowby Michael S | -- | Equity Title Agency Inc |
Source: Public Records
Mortgage History
| Date | Status | Borrower | Loan Amount |
|---|---|---|---|
| Open | Long Db | $220,000 | |
| Previous Owner | Sowby Michael S | $83,000 |
Source: Public Records
Tax History Compared to Growth
Tax History
| Year | Tax Paid | Tax Assessment Tax Assessment Total Assessment is a certain percentage of the fair market value that is determined by local assessors to be the total taxable value of land and additions on the property. | Land | Improvement |
|---|---|---|---|---|
| 2025 | $3,641 | $443,355 | $237,900 | $568,200 |
| 2024 | $3,641 | $404,525 | $0 | $0 |
| 2023 | $3,391 | $399,465 | $0 | $0 |
| 2022 | $3,385 | $393,470 | $0 | $0 |
| 2021 | $2,913 | $528,900 | $170,700 | $358,200 |
| 2020 | $2,731 | $481,000 | $152,400 | $328,600 |
| 2019 | $2,578 | $469,600 | $141,000 | $328,600 |
| 2018 | $2,579 | $449,100 | $133,400 | $315,700 |
| 2017 | $2,516 | $236,500 | $0 | $0 |
| 2016 | $2,489 | $217,360 | $0 | $0 |
| 2015 | $2,623 | $217,360 | $0 | $0 |
| 2014 | $2,439 | $199,430 | $0 | $0 |
Source: Public Records
Map
Nearby Homes
- 540 N 300 W
- 641 N 420 W
- 356 N 480 W
- 370 W Pacific Dr Unit 1
- 399 W Pacific Dr
- 621 N 100 W
- 365 N 100 W
- 782 N 200 W
- 796 N 200 W
- 914 N 400 W Unit A
- 3889 W 950 Cir N Unit 366
- 962 N 780 St W Unit 508
- 974 N 780 St W Unit 509
- 916 N 780 St W Unit 501
- 120 N 350 W Unit 133
- 120 N 350 W Unit 130
- 374 N Center St
- 984 N 300 W
- 987 N 410 W
- 822 W 800 St N Unit LOT319