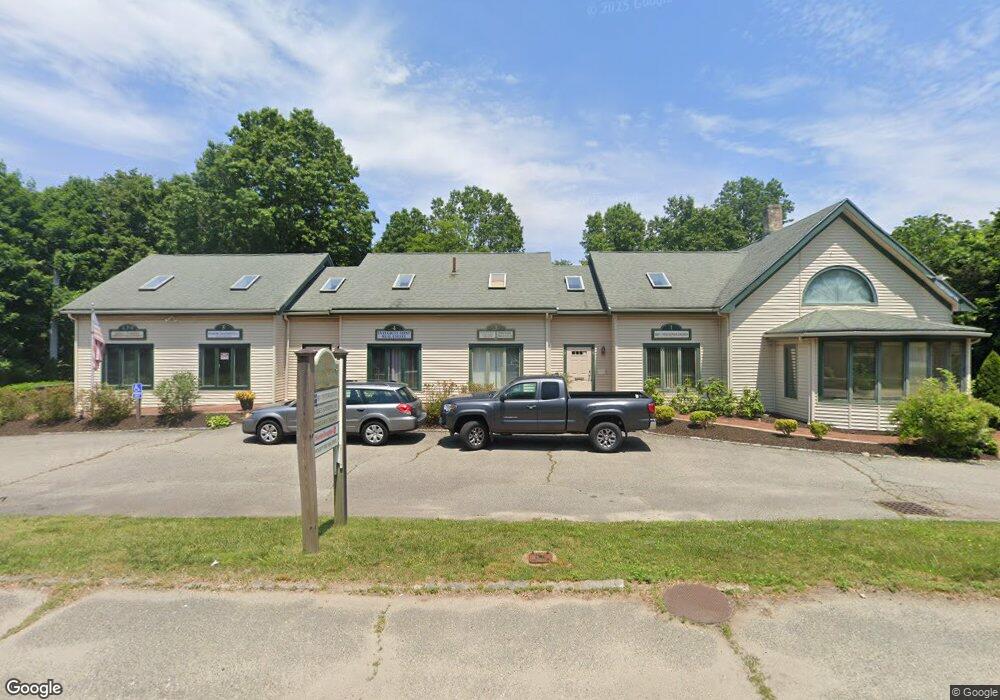
488 State Rd Rt 3a Unit 5 Plymouth, MA 02360
Estimated Value: $118,454
--
Bed
--
Bath
1,126
Sq Ft
$105/Sq Ft
Est. Value
About This Home
This home is located at 488 State Rd Rt 3a Unit 5, Plymouth, MA 02360 and is currently estimated at $118,454, approximately $105 per square foot. 488 State Rd Rt 3a Unit 5 is a home located in Plymouth County with nearby schools including Nathaniel Morton Elementary School, Plymouth Community Intermediate, and Plymouth North High School.
Ownership History
Date
Name
Owned For
Owner Type
Purchase Details
Closed on
Mar 27, 2025
Sold by
Finlay Rodney H and Finlay Suzanne M
Bought by
Fahle John and Fahle Carrie
Current Estimated Value
Purchase Details
Closed on
Jun 11, 2020
Sold by
Czervik Rt
Bought by
Finlay Rodney H and Finlay Suzanne M
Purchase Details
Closed on
Dec 23, 2010
Sold by
Intercast Usa Inc
Bought by
Czervik Rt and Palmer
Purchase Details
Closed on
Apr 18, 2000
Sold by
Beard Peter J
Bought by
Intercast Usa Inc
Purchase Details
Closed on
Jul 12, 1995
Sold by
George Ft and George Lorraine E
Bought by
Beard Peter J
Purchase Details
Closed on
Aug 10, 1992
Sold by
Plymouth Fed Sb
Bought by
George Thomas A and George Fred M
Purchase Details
Closed on
Apr 19, 1991
Sold by
Seaman Edmund F and Seaman Florence M
Bought by
Plymouth Fed Sb
Create a Home Valuation Report for This Property
The Home Valuation Report is an in-depth analysis detailing your home's value as well as a comparison with similar homes in the area
Home Values in the Area
Average Home Value in this Area
Purchase History
| Date | Buyer | Sale Price | Title Company |
|---|---|---|---|
| Fahle John | $113,000 | None Available | |
| Fahle John | $113,000 | None Available | |
| Finlay Rodney H | $60,000 | None Available | |
| Finlay Rodney H | $60,000 | None Available | |
| Czervik Rt | $20,000 | -- | |
| Czervik Rt | $20,000 | -- | |
| Intercast Usa Inc | $58,000 | -- | |
| Intercast Usa Inc | $58,000 | -- | |
| Beard Peter J | $50,000 | -- | |
| Beard Peter J | $50,000 | -- | |
| George Thomas A | $12,000 | -- | |
| George Thomas A | $12,000 | -- | |
| Plymouth Fed Sb | $84,100 | -- | |
| Plymouth Fed Sb | $84,100 | -- |
Source: Public Records
Mortgage History
| Date | Status | Borrower | Loan Amount |
|---|---|---|---|
| Previous Owner | Plymouth Fed Sb | $30,000 |
Source: Public Records
Tax History Compared to Growth
Tax History
| Year | Tax Paid | Tax Assessment Tax Assessment Total Assessment is a certain percentage of the fair market value that is determined by local assessors to be the total taxable value of land and additions on the property. | Land | Improvement |
|---|---|---|---|---|
| 2025 | $2,085 | $164,300 | $0 | $164,300 |
| 2024 | $1,983 | $154,100 | $0 | $154,100 |
| 2023 | $2,070 | $151,000 | $0 | $151,000 |
| 2022 | $1,796 | $116,400 | $0 | $116,400 |
| 2021 | $1,774 | $109,800 | $0 | $109,800 |
| 2020 | $1,792 | $109,600 | $0 | $109,600 |
| 2019 | $1,905 | $115,200 | $0 | $115,200 |
| 2018 | $1,896 | $115,200 | $0 | $115,200 |
| 2017 | $1,794 | $108,200 | $0 | $108,200 |
| 2016 | $1,782 | $109,500 | $0 | $109,500 |
| 2015 | $1,702 | $109,500 | $0 | $109,500 |
| 2014 | $1,610 | $106,400 | $0 | $106,400 |
Source: Public Records
Map
Nearby Homes
- 65 Old Field Rd Unit 65
- 84 Old Field Rd Unit 84
- 15 Cedar Rd
- 583 State Rd
- 814 Rocky Hill Rd
- 9 Sunflower Way
- 4 Priscilla Beach Rd
- 88 Beach St
- 4 Lady Bug Ln
- 3 Lady Bug Ln
- 18 Beach St
- 127C Taylor Ave
- 54 Manomet Point Rd
- 59 Hilltop Ave
- 22 Presidents Ln
- 52 Taylor Ave
- 10 Tideview Path Unit 18
- 9 Tideview Path Unit 8
- 9 Tideview Path Unit 10
- 2 Tideview Path Unit 4
- 488 Unit4C State Rd
- 488 unit4B State Rd
- 488 unit 5 State Rd
- 488 State Rd Unit 3
- 488 State Rd
- 488 State Rd Unit 3
- 488 State Rd Unit TOP
- 488 State Rd Unit MAIN
- 488 State Rd Unit 4 A
- 488 State Rd Unit 4 C
- 488 State Rd Unit 1st Floor
- 488 State Rd Unit Lower Leval
- 488 State Rd Unit 1-B
- 488 State Rd Unit 1-A
- 488 State Rd Unit 2nd floor
- 488 State Rd Unit 2-lowe
- 488 State Rd Unit 2-1st floor
- 488 State Rd Unit lower
- 488 State Rd Unit 2nd
- 488 State Rd Unit 4