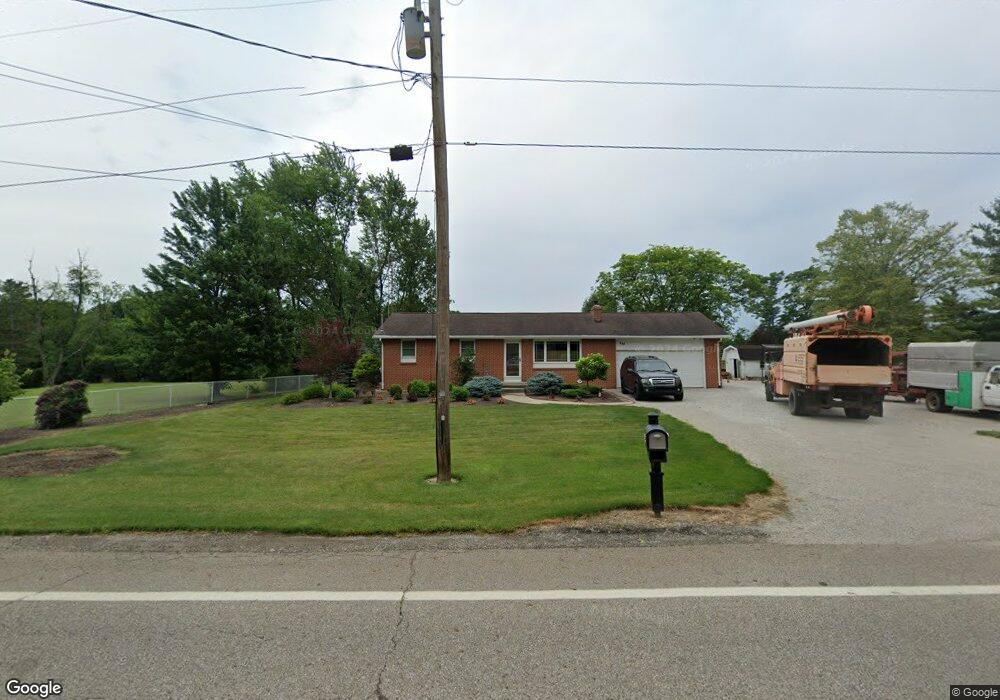
488 State Route 96 E Shiloh, OH 44878
Estimated Value: $172,000 - $325,000
3
Beds
2
Baths
1,040
Sq Ft
$218/Sq Ft
Est. Value
About This Home
This home is located at 488 State Route 96 E, Shiloh, OH 44878 and is currently estimated at $227,202, approximately $218 per square foot. 488 State Route 96 E is a home located in Richland County with nearby schools including Crestview Elementary School, Crestview Middle School, and Crestview High School.
Ownership History
Date
Name
Owned For
Owner Type
Purchase Details
Closed on
Sep 15, 2006
Sold by
Rall Brad D and Rall Cynthia R
Bought by
Likes Carol A and Robertson David M
Current Estimated Value
Home Financials for this Owner
Home Financials are based on the most recent Mortgage that was taken out on this home.
Original Mortgage
$99,750
Outstanding Balance
$57,763
Interest Rate
6.59%
Mortgage Type
Purchase Money Mortgage
Estimated Equity
$169,439
Purchase Details
Closed on
Apr 19, 1995
Sold by
Badger Julia A
Bought by
Rall Brad D and Stanger Cynthia R
Home Financials for this Owner
Home Financials are based on the most recent Mortgage that was taken out on this home.
Original Mortgage
$59,925
Interest Rate
8.64%
Mortgage Type
New Conventional
Purchase Details
Closed on
Jun 22, 1993
Sold by
Edwards Paul
Bought by
Badger Julia A
Purchase Details
Closed on
Jul 1, 1985
Create a Home Valuation Report for This Property
The Home Valuation Report is an in-depth analysis detailing your home's value as well as a comparison with similar homes in the area
Purchase History
| Date | Buyer | Sale Price | Title Company |
|---|---|---|---|
| Likes Carol A | $105,000 | Barrister Title | |
| Rall Brad D | $70,500 | -- | |
| Badger Julia A | $55,000 | -- | |
| -- | $50,000 | -- |
Source: Public Records
Mortgage History
| Date | Status | Borrower | Loan Amount |
|---|---|---|---|
| Open | Likes Carol A | $99,750 | |
| Previous Owner | Rall Brad D | $59,925 |
Source: Public Records
Tax History
| Year | Tax Paid | Tax Assessment Tax Assessment Total Assessment is a certain percentage of the fair market value that is determined by local assessors to be the total taxable value of land and additions on the property. | Land | Improvement |
|---|---|---|---|---|
| 2025 | $1,853 | $51,110 | $8,800 | $42,310 |
| 2024 | $1,853 | $51,110 | $8,800 | $42,310 |
| 2023 | $1,901 | $51,110 | $8,800 | $42,310 |
| 2022 | $1,709 | $42,630 | $8,280 | $34,350 |
| 2021 | $1,648 | $41,070 | $8,280 | $32,790 |
| 2020 | $1,568 | $38,960 | $8,280 | $30,680 |
| 2019 | $1,390 | $32,750 | $6,950 | $25,800 |
| 2018 | $1,404 | $32,750 | $6,950 | $25,800 |
| 2017 | $1,341 | $32,750 | $6,950 | $25,800 |
| 2016 | $1,302 | $32,220 | $5,910 | $26,310 |
| 2015 | $1,302 | $32,220 | $5,910 | $26,310 |
| 2014 | $1,358 | $32,220 | $5,910 | $26,310 |
| 2012 | $644 | $32,220 | $5,910 | $26,310 |
Source: Public Records
Map
Nearby Homes
- 1121 Clayberg Rd Unit 65
- 1121 Clayberg Rd Unit 75
- 1121 Clayberg Rd Unit 58
- 1121 Clayberg Rd Unit 115
- 1121 Clayberg Rd Unit 63
- 1121 Clayberg Rd Unit 108
- Lot #4271 W Main
- 4253 NE North Main St
- 4250 Mansfield Adario Rd
- 447 Ohio 603
- 3639 N Main St
- 430 Adario West Rd
- 3493 Ganges Five Points Rd
- 3493 Ganges-Five Points Rd
- 412 Lattimer Rd W
- 3695 McNaul Rd
- 1258 Township Road 1453
- 0 Miller Pkwy
- 395 Cairns Rd
- 3621 Plymouth Springmill Rd
- 488 Ohio 96
- 468 State Route 96 E
- 468 Ohio 96
- 487 State Route 96 E
- 497 State Route 96 E
- 520 State Route 96 E
- 513 State Route 96 E
- 453 State Route 96 E
- 439 State Route 96 E
- 430 State Route 96 E
- 414 State Route 96 E
- 464 State Route 96 E
- 575 State Route 96 E
- 359 State Route 96 E
- 359 Ohio 96
- 345 State Route 96 E
- 345 Ohio 96
- 323 State Route 96 E
- 323 Ohio 96
- 650 State Route 96 E
Your Personal Tour Guide
Ask me questions while you tour the home.