Estimated Value: $195,581 - $242,000
--
Bed
1
Bath
1,686
Sq Ft
$130/Sq Ft
Est. Value
About This Home
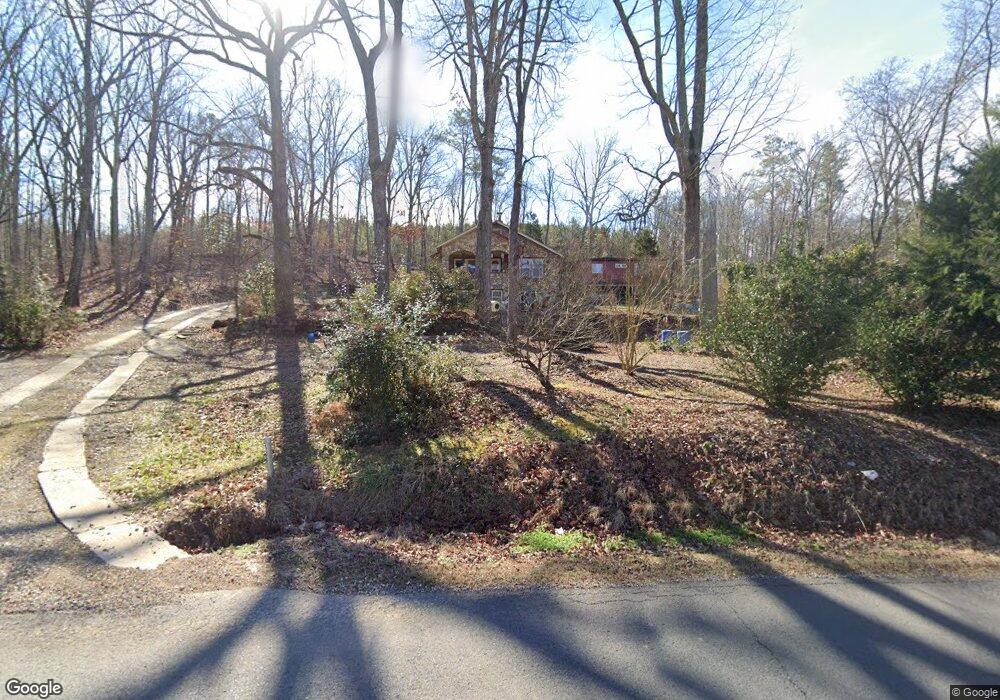
This home is located at 488 Wayside Rd NE, Rome, GA 30161 and is currently estimated at $219,145, approximately $129 per square foot. 488 Wayside Rd NE is a home located in Floyd County with nearby schools including Model Middle School, Model High School, and Unity Christian School.
Ownership History
Date
Name
Owned For
Owner Type
Purchase Details
Closed on
Apr 5, 2025
Sold by
Pack Ramona Lee
Bought by
Pack William Anthony
Current Estimated Value
Purchase Details
Closed on
Jul 25, 2023
Sold by
Tolbert Marjorie H
Bought by
Pack William A
Purchase Details
Closed on
May 18, 2011
Sold by
Pack William A
Bought by
Tolbert Marjorie H
Purchase Details
Closed on
Dec 15, 2010
Sold by
Sc Capital Llc
Bought by
Pack William A
Purchase Details
Closed on
Sep 30, 2010
Sold by
United Community Bank
Bought by
Sc Capital Llc
Purchase Details
Closed on
May 4, 2010
Sold by
Hester Benjamin
Bought by
United Community Bank
Purchase Details
Closed on
Aug 5, 1999
Sold by
Hatch James M and Judy Hatch
Bought by
Hester Benjamin D
Purchase Details
Closed on
Dec 24, 1990
Sold by
Sunny Hill Baptist Church
Bought by
Hatch James M and Judy Hatch
Purchase Details
Closed on
Dec 21, 1965
Sold by
Shaw W D
Bought by
Sunny Hill Baptist Church
Purchase Details
Closed on
Jan 1, 1957
Bought by
Shaw W D
Create a Home Valuation Report for This Property
The Home Valuation Report is an in-depth analysis detailing your home's value as well as a comparison with similar homes in the area
Home Values in the Area
Average Home Value in this Area
Purchase History
| Date | Buyer | Sale Price | Title Company |
|---|---|---|---|
| Pack William Anthony | $55,000 | -- | |
| Pack William A | -- | -- | |
| Tolbert Marjorie H | $37,900 | -- | |
| Pack William A | $37,900 | -- | |
| Sc Capital Llc | $83,818 | -- | |
| United Community Bank | $55,000 | -- | |
| Hester Benjamin D | $32,600 | -- | |
| Hatch James M | $28,000 | -- | |
| Sunny Hill Baptist Church | $11,000 | -- | |
| Shaw W D | -- | -- |
Source: Public Records
Tax History Compared to Growth
Tax History
| Year | Tax Paid | Tax Assessment Tax Assessment Total Assessment is a certain percentage of the fair market value that is determined by local assessors to be the total taxable value of land and additions on the property. | Land | Improvement |
|---|---|---|---|---|
| 2024 | $1,834 | $67,280 | $15,840 | $51,440 |
| 2023 | $1,283 | $44,745 | $14,400 | $30,345 |
| 2022 | $1,038 | $34,994 | $11,424 | $23,570 |
| 2021 | $922 | $30,558 | $10,391 | $20,167 |
| 2020 | $852 | $27,994 | $9,036 | $18,958 |
| 2019 | $805 | $26,815 | $9,036 | $17,779 |
| 2018 | $753 | $25,022 | $8,606 | $16,416 |
| 2017 | $714 | $23,670 | $7,968 | $15,702 |
| 2016 | $707 | $23,167 | $7,960 | $15,207 |
| 2015 | $691 | $23,167 | $7,960 | $15,207 |
| 2014 | $691 | $23,167 | $7,960 | $15,207 |
Source: Public Records
Map
Nearby Homes
- 424 Wayside Rd NE
- 608 Wayside Rd NE
- 637 Wayside Rd NE
- 5 Larkwood Dr NE
- 197 Wayside Rd NE
- 0 Calhoun Rd NE Unit 7516251
- 0 Calhoun Rd NE Unit 10488821
- 84 Harris Rd NE
- 16 Maycroft Ct
- 13 Maycroft Ct
- 492 Moran Lake Rd NE
- 118 Dekle Dr NE
- 109 Dekle Dr NE
- 108 Dekle Dr NE
- 107 Whispering Pines NE
- 105 Whispering Pines NE
- 0 Scarlett Ln Unit 10548767
- 0 Scarlett Ln Unit 7601914
- 3 Dekle Dr NE
- 26 Greer Dr NE
- 502 Wayside Rd NE
- 477 Wayside Rd NE
- 534 Wayside Rd NE
- 457 Wayside Rd NE
- 457 Wayside Rd NE
- 448 Wayside Rd NE
- 525 Wayside Rd NE
- 443 Wayside Rd NE
- 443 Wayside Rd NE
- 564 Wayside Rd NE
- 427 Wayside Rd NE
- 418 Wayside Rd NE
- 0 May St Unit 20054553
- 26 Mayo Rd NE
- 410 Wayside Rd NE
- 551 Wayside Rd NE
- 592 Wayside Rd NE
- 413 Wayside Rd NE
- 394 Wayside Rd NE
- 19 Wildwood Ln NE