Estimated Value: $250,000 - $265,000
3
Beds
2
Baths
1,384
Sq Ft
$186/Sq Ft
Est. Value
About This Home
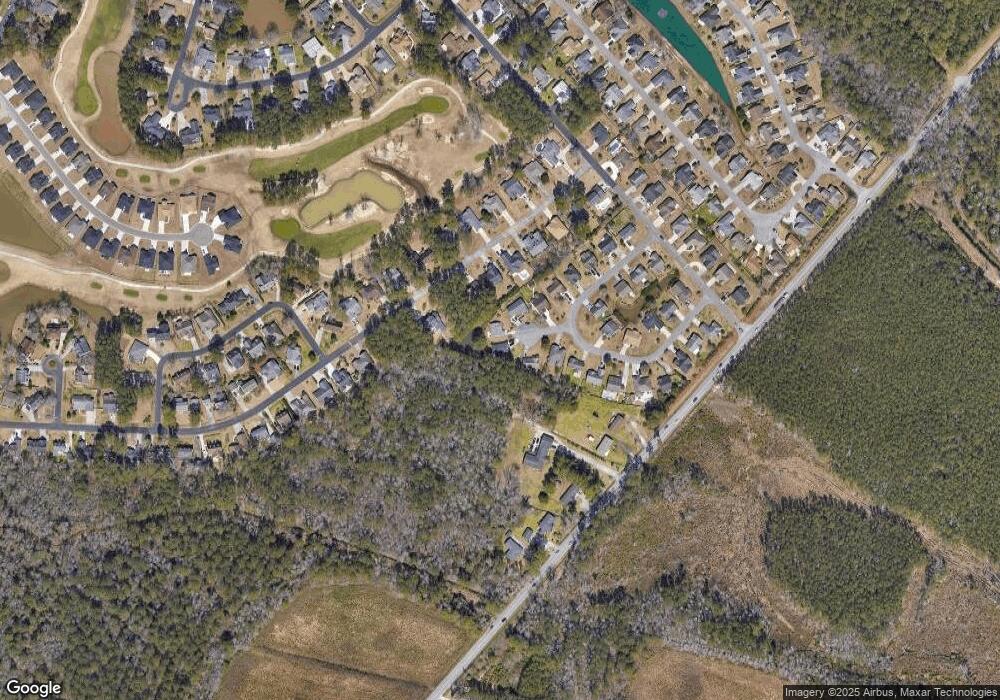
This home is located at 488 Weymouth Ct, Longs, SC 29568 and is currently estimated at $256,743, approximately $185 per square foot. 488 Weymouth Ct is a home located in Horry County with nearby schools including Riverside Elementary School, North Myrtle Beach Middle School, and North Myrtle Beach High School.
Ownership History
Date
Name
Owned For
Owner Type
Purchase Details
Closed on
Jan 2, 2019
Sold by
Murphys Landing Llc
Bought by
Campanelli Carolyn M
Current Estimated Value
Purchase Details
Closed on
Feb 12, 2007
Sold by
Ungaro Timothy J
Bought by
Campanelli Steven A and Campanelli Carolyn M
Home Financials for this Owner
Home Financials are based on the most recent Mortgage that was taken out on this home.
Original Mortgage
$33,980
Interest Rate
6.17%
Mortgage Type
Stand Alone Second
Purchase Details
Closed on
Mar 11, 2005
Sold by
Laudano Anthony F
Bought by
Ungaro Timothy J
Home Financials for this Owner
Home Financials are based on the most recent Mortgage that was taken out on this home.
Original Mortgage
$126,400
Interest Rate
7.45%
Mortgage Type
Unknown
Purchase Details
Closed on
Apr 8, 1999
Sold by
Colonial Charters Assoc Ltd Prtnrshp
Bought by
Colonial Patriot Llc
Create a Home Valuation Report for This Property
The Home Valuation Report is an in-depth analysis detailing your home's value as well as a comparison with similar homes in the area
Home Values in the Area
Average Home Value in this Area
Purchase History
| Date | Buyer | Sale Price | Title Company |
|---|---|---|---|
| Campanelli Carolyn M | $14,700 | -- | |
| Campanelli Steven A | $169,900 | None Available | |
| Ungaro Timothy J | $158,000 | -- | |
| Colonial Patriot Llc | $310,000 | -- |
Source: Public Records
Mortgage History
| Date | Status | Borrower | Loan Amount |
|---|---|---|---|
| Previous Owner | Campanelli Steven A | $33,980 | |
| Previous Owner | Campanelli Steven A | $135,920 | |
| Previous Owner | Ungaro Timothy J | $126,400 | |
| Previous Owner | Ungaro Timothy J | $31,600 |
Source: Public Records
Tax History
| Year | Tax Paid | Tax Assessment Tax Assessment Total Assessment is a certain percentage of the fair market value that is determined by local assessors to be the total taxable value of land and additions on the property. | Land | Improvement |
|---|---|---|---|---|
| 2025 | $542 | $0 | $0 | $0 |
| 2024 | $542 | $9,198 | $2,722 | $6,476 |
| 2023 | $542 | $6,022 | $1,226 | $4,796 |
| 2021 | $470 | $6,022 | $1,226 | $4,796 |
| 2020 | $394 | $6,022 | $1,226 | $4,796 |
| 2019 | $394 | $6,022 | $1,226 | $4,796 |
| 2018 | $0 | $5,280 | $1,304 | $3,976 |
| 2017 | $502 | $5,280 | $1,304 | $3,976 |
| 2016 | -- | $5,280 | $1,304 | $3,976 |
| 2015 | $502 | $5,280 | $1,304 | $3,976 |
| 2014 | $464 | $5,280 | $1,304 | $3,976 |
Source: Public Records
Map
Nearby Homes
- 412 Plymouth Loop
- 2281 Seaford Dr
- 247 Sienna Dr
- 110 Ashworth Dr
- 4024 Comfort Valley Dr
- 2425 Bittar Spar Rd
- 2321 Brick Dr
- 501 Topaz Ave
- 105 Retreat Place
- 2532 Stonesedge Blvd
- 2500 Stonesedge Blvd
- 2708 Desert Rose St
- 108 Nunn Ct
- 155 Retreat Place
- 120 Staton Ln
- 482 Shellbank Dr
- 517 Topaz Ave
- 82 Palmetto Green Dr
- 206 Forest Dr
- 199 Palmetto Green Dr
- 487 Weymouth Ct
- 492 Weymouth Ct
- 491 Weymouth Ct
- 491 Weymouth Ct Unit LR
- 2620 Brick Dr
- 2612 Brick Dr
- 496 Weymouth Ct
- 2624 Brick Dr Unit Colonial Club Estate
- 2624 Brick Dr
- 495 Weymouth Ct
- 495 Weymouth Ct Unit Patriot Pointe-Colon
- 408 Plymouth Loop
- 408 Plymouth Loop Unit Patriot Pointe - Col
- 408 Plymouth Loop Unit 408 Plymouth Loop
- 2628 Brick Dr
- 396 Plymouth Loop
- 2617 Brick Dr
- 2632 Brick Dr
- 392 Plymouth Loop
- 2613 Brick Dr
Your Personal Tour Guide
Ask me questions while you tour the home.