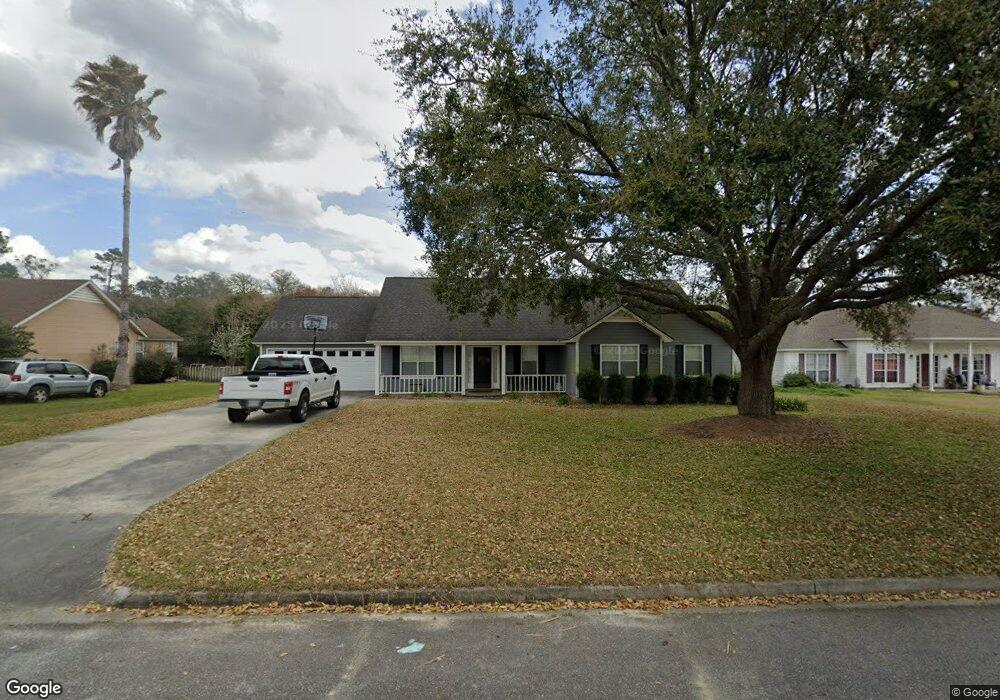
4883 Ben Salem Way Hahira, GA 31632
Estimated Value: $288,921 - $341,000
5
Beds
2
Baths
2,264
Sq Ft
$139/Sq Ft
Est. Value
About This Home
This home is located at 4883 Ben Salem Way, Hahira, GA 31632 and is currently estimated at $315,730, approximately $139 per square foot. 4883 Ben Salem Way is a home located in Lowndes County with nearby schools including Hahira Elementary School, Hahira Middle School, and Lowndes High School.
Ownership History
Date
Name
Owned For
Owner Type
Purchase Details
Closed on
Jul 25, 2013
Sold by
Ridge Bradley G
Bought by
Elliott Rueben T and Elliott Lindsi K
Current Estimated Value
Home Financials for this Owner
Home Financials are based on the most recent Mortgage that was taken out on this home.
Original Mortgage
$161,900
Outstanding Balance
$114,322
Interest Rate
3.25%
Mortgage Type
New Conventional
Estimated Equity
$201,408
Purchase Details
Closed on
Jul 28, 2003
Sold by
Wyatt Rudy C and Wyatt Wanda C
Bought by
Ridge Bradley G & Rebecca H
Purchase Details
Closed on
Aug 22, 2000
Sold by
Zentz Donald M and Zentz Laurie
Bought by
Wyatt Rudy C and Wyatt Wanda C
Purchase Details
Closed on
Jul 9, 1999
Sold by
Lightfoot Craig M
Bought by
Zentz Donald M and Zentz Laurie
Purchase Details
Closed on
May 8, 1997
Bought by
Lightfoot Craig M
Purchase Details
Closed on
Jan 14, 1994
Bought by
Tlg Inc
Create a Home Valuation Report for This Property
The Home Valuation Report is an in-depth analysis detailing your home's value as well as a comparison with similar homes in the area
Home Values in the Area
Average Home Value in this Area
Purchase History
| Date | Buyer | Sale Price | Title Company |
|---|---|---|---|
| Elliott Rueben T | $179,900 | -- | |
| Ridge Bradley G & Rebecca H | $158,000 | -- | |
| Wyatt Rudy C | $144,500 | -- | |
| Zentz Donald M | $142,000 | -- | |
| Lightfoot Craig M | $145,100 | -- | |
| Tlg Inc | -- | -- |
Source: Public Records
Mortgage History
| Date | Status | Borrower | Loan Amount |
|---|---|---|---|
| Open | Elliott Rueben T | $161,900 |
Source: Public Records
Tax History Compared to Growth
Tax History
| Year | Tax Paid | Tax Assessment Tax Assessment Total Assessment is a certain percentage of the fair market value that is determined by local assessors to be the total taxable value of land and additions on the property. | Land | Improvement |
|---|---|---|---|---|
| 2024 | $2,503 | $102,981 | $13,200 | $89,781 |
| 2023 | $2,375 | $102,981 | $13,200 | $89,781 |
| 2022 | $2,018 | $76,176 | $13,200 | $62,976 |
| 2021 | $2,105 | $76,176 | $13,200 | $62,976 |
| 2020 | $1,657 | $65,012 | $13,200 | $51,812 |
| 2019 | $1,674 | $65,012 | $13,200 | $51,812 |
| 2018 | $1,691 | $65,012 | $13,200 | $51,812 |
| 2017 | $1,710 | $65,012 | $13,200 | $51,812 |
| 2016 | $1,714 | $65,012 | $13,200 | $51,812 |
| 2015 | -- | $65,012 | $13,200 | $51,812 |
| 2014 | $1,745 | $65,436 | $13,200 | $52,236 |
Source: Public Records
Map
Nearby Homes
- 4759 Bethany Dr
- 4958 Bethany Dr
- 3800 Cutshaw Trail
- 4710 Summerfield Dr
- 4176 Cider Trail
- The Carol Plan at Ballantyne
- The Ryleigh Plan at Ballantyne
- The Embry Plan at Ballantyne
- The Belfort Plan at Ballantyne
- 1000 Ballantyne Ln
- 3908 Cutshaw Trail
- 4160 Willow Round Rd
- 4167 Silver Glen
- Lot 7 Mcmillan Rd
- Lot 3 Mcmillan Rd
- Lot 1 Mcmillan Rd
- Lot 4 Mcmillan Rd
- Lot 2A Mcmillan Rd
- 5388 Hall Rd
- 5460 Union Rd
- 4875 Ben Salem Way
- 4889 Ben Salem Way
- 4867 Ben Salem Way
- 4886 Ben Salem Way
- 4880 Ben Salem Way
- 4646 Val Del Rd
- 4864 Ben Salem Way
- 4705 Ben Salem Way
- 4711 Ben Salem Way
- 4730 Ben Salem Way
- 4719 Ben Salem Way
- 4852 Ben Salem Way
- 4681 Val Del Rd
- 4736 Ben Salem Way
- 4727 Ben Salem Way
- 4861 Ben Salem Way
- 4818 Ellen's Walk
- 4818 Ellens Walk
- 4824 Ellens Walk
- 4855 Ben Salem Way