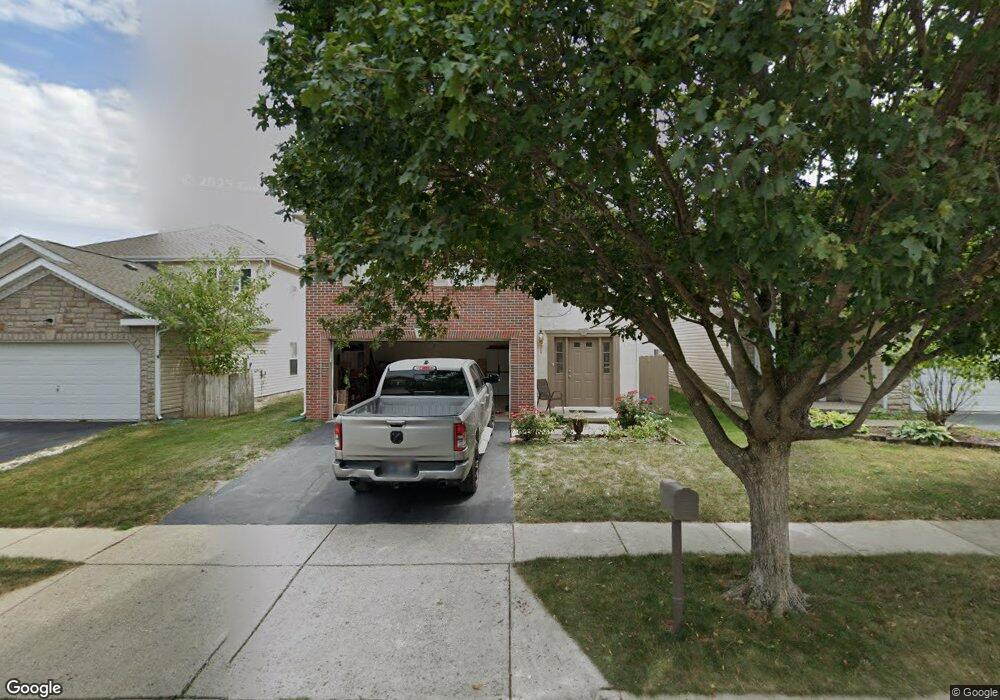
4886 Grimm Dr Lockbourne, OH 43137
Obetz-Lockbourne NeighborhoodEstimated Value: $314,000 - $336,000
4
Beds
4
Baths
2,440
Sq Ft
$133/Sq Ft
Est. Value
About This Home
This home is located at 4886 Grimm Dr, Lockbourne, OH 43137 and is currently estimated at $324,183, approximately $132 per square foot. 4886 Grimm Dr is a home located in Franklin County with nearby schools including Cedarwood Alternative Elementary School @ Stockbri, Buckeye Middle School, and Marion-Franklin High School.
Ownership History
Date
Name
Owned For
Owner Type
Purchase Details
Closed on
Aug 25, 2017
Sold by
Carpenter Dex E
Bought by
Sami Aoss
Current Estimated Value
Purchase Details
Closed on
Mar 8, 2011
Sold by
Secretary Of Housing & Urban Development
Bought by
Sami Wisam and Sami Ghada
Purchase Details
Closed on
Feb 9, 2010
Sold by
Robinson Tina N and Taylor Bean
Bought by
Bac Home Loans Servicing Lp and Countrywide Home Loan Servicing Lp
Purchase Details
Closed on
Dec 11, 2009
Sold by
Bac Home Loans Servicing Lp
Bought by
Secretary Of Housing # Urban Development
Purchase Details
Closed on
Aug 8, 2006
Sold by
Maronda Homes Inc Of Ohio
Bought by
Robinson Tina N
Home Financials for this Owner
Home Financials are based on the most recent Mortgage that was taken out on this home.
Original Mortgage
$170,327
Interest Rate
6.83%
Mortgage Type
FHA
Purchase Details
Closed on
Jul 14, 2005
Sold by
Intrust Land Development Co
Bought by
Maronda Homes Inc Of Ohio
Create a Home Valuation Report for This Property
The Home Valuation Report is an in-depth analysis detailing your home's value as well as a comparison with similar homes in the area
Home Values in the Area
Average Home Value in this Area
Purchase History
We collect this data history from publicly available records. To have your information removed, we recommend requesting removal directly through your county’s website.
| Date | Buyer | Sale Price | Title Company |
|---|---|---|---|
| Sami Aoss | $91,000 | None Available | |
| Sami Wisam | $85,000 | Lakeside Ti | |
| Bac Home Loans Servicing Lp | $96,000 | None Available | |
| Secretary Of Housing # Urban Development | -- | None Available | |
| Robinson Tina N | $173,000 | Stewart Tit | |
| Maronda Homes Inc Of Ohio | $1,711,000 | -- |
Source: Public Records
Mortgage History
We collect this data history from publicly available records. To have your information removed, we recommend requesting removal directly through your county’s website.
| Date | Status | Borrower | Loan Amount |
|---|---|---|---|
| Previous Owner | Robinson Tina N | $170,327 |
Source: Public Records
Tax History
| Year | Tax Paid | Tax Assessment Tax Assessment Total Assessment is a certain percentage of the fair market value that is determined by local assessors to be the total taxable value of land and additions on the property. | Land | Improvement |
|---|---|---|---|---|
| 2025 | $4,178 | $93,100 | $21,000 | $72,100 |
| 2024 | $4,178 | $93,100 | $21,000 | $72,100 |
| 2023 | $4,125 | $93,100 | $21,000 | $72,100 |
| 2022 | $3,119 | $60,140 | $3,610 | $56,530 |
| 2021 | $3,125 | $60,140 | $3,610 | $56,530 |
| 2020 | $3,129 | $60,140 | $3,610 | $56,530 |
| 2019 | $3,023 | $49,840 | $3,010 | $46,830 |
| 2018 | $1,542 | $50,930 | $3,010 | $47,920 |
| 2017 | $3,088 | $50,930 | $3,010 | $47,920 |
| 2016 | $3,047 | $46,000 | $7,040 | $38,960 |
| 2015 | $1,383 | $46,000 | $7,040 | $38,960 |
| 2014 | $2,773 | $46,000 | $7,040 | $38,960 |
| 2013 | $1,368 | $45,990 | $7,035 | $38,955 |
Source: Public Records
Map
Nearby Homes
- 318 Kear St
- 5021 Grimm Dr
- 4980 Fosterson Dr
- 4640 Grandover Dr
- 4903 Astoria Ave
- 733 Youn-Kin Pkwy S
- 696 Riviera Ct
- 4990 Root Place
- 4436 Wesley Trail
- 4303 Oakwind Dr
- 4285 Oakwind Dr
- 4926 Meadowbrook Dr
- 956 Scarlett Ln
- 5120 Fairlane Rd
- 4280 French Creek Dr
- 4141 Kershaw Dr
- 1093 Gartner Ct
- 4117 Kershaw Dr
- 4077 Torbert Way
- 1107 Gelbray Dr
- 4892 Grimm Dr
- 4892 Grimm Dr Unit 78
- 4880 Grimm Dr
- 4880 Grimm Dr
- 4880 Grimm Dr Unit 80
- 4898 Grimm Dr
- 4898 Grimm Dr Unit 77
- 425 Saul St
- 4904 Grimm Dr
- 4904 Grimm Dr Unit 76
- 433 Saul St
- 4889 Grimm Dr
- 4877 Grimm Dr
- 4877 Grimm Dr
- 4877 Grimm Dr Unit 87
- 4910 Grimm Dr
- 4910 Grimm Dr Unit 75
- 4902 Crestbrook Dr
- 4883 Grimm Dr
- 4871 Grimm Dr
Your Personal Tour Guide
Ask me questions while you tour the home.