Estimated Value: $381,000 - $431,000
4
Beds
2
Baths
1,946
Sq Ft
$209/Sq Ft
Est. Value
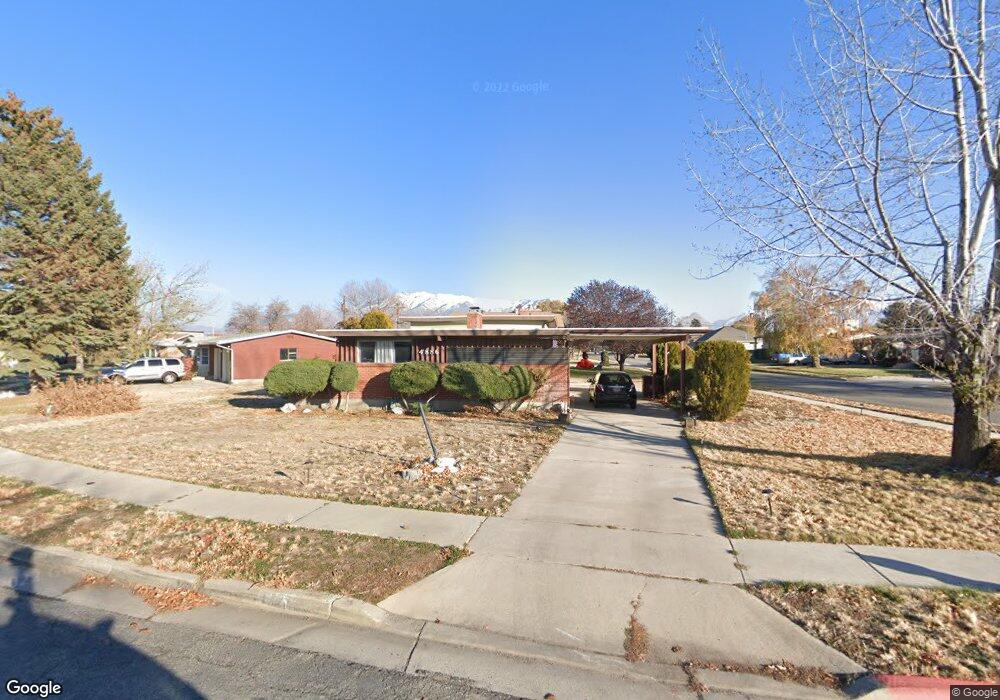
About This Home
This home is located at 4886 S 2350 W, Roy, UT 84067 and is currently estimated at $406,862, approximately $209 per square foot. 4886 S 2350 W is a home located in Weber County with nearby schools including Lakeview Elementary School, Roy Junior High School, and Roy High School.
Ownership History
Date
Name
Owned For
Owner Type
Purchase Details
Closed on
Oct 21, 2013
Sold by
Canyon Advantage Llc
Bought by
Wheeler Danna June
Current Estimated Value
Purchase Details
Closed on
Jul 30, 2013
Sold by
Nicholls Patricia P
Bought by
Canyon Advantage Llc
Purchase Details
Closed on
Dec 27, 1995
Sold by
Thomas Wilford and Thomas Aneesa
Bought by
Thomas Wilford and Thomas Aneesa P
Create a Home Valuation Report for This Property
The Home Valuation Report is an in-depth analysis detailing your home's value as well as a comparison with similar homes in the area
Home Values in the Area
Average Home Value in this Area
Purchase History
| Date | Buyer | Sale Price | Title Company |
|---|---|---|---|
| Wheeler Danna June | -- | Integrated Title Ins Servici | |
| Canyon Advantage Llc | -- | First American Bountiful | |
| Nicholls Patricia P | -- | First American Bountiful | |
| Thomas Wilford | -- | -- |
Source: Public Records
Tax History Compared to Growth
Tax History
| Year | Tax Paid | Tax Assessment Tax Assessment Total Assessment is a certain percentage of the fair market value that is determined by local assessors to be the total taxable value of land and additions on the property. | Land | Improvement |
|---|---|---|---|---|
| 2025 | $2,230 | $346,631 | $126,265 | $220,366 |
| 2024 | $2,127 | $182,599 | $69,446 | $113,153 |
| 2023 | $2,138 | $184,800 | $65,733 | $119,067 |
| 2022 | $2,390 | $215,600 | $59,861 | $155,739 |
| 2021 | $1,804 | $264,000 | $72,748 | $191,252 |
| 2020 | $1,703 | $229,000 | $72,748 | $156,252 |
| 2019 | $1,778 | $227,000 | $42,357 | $184,643 |
| 2018 | $1,611 | $192,000 | $39,157 | $152,843 |
| 2017 | $1,478 | $164,000 | $39,157 | $124,843 |
| 2016 | $1,370 | $81,163 | $19,688 | $61,475 |
| 2015 | $1,220 | $73,254 | $19,688 | $53,566 |
| 2014 | $1,231 | $73,255 | $16,808 | $56,447 |
Source: Public Records
Map
Nearby Homes