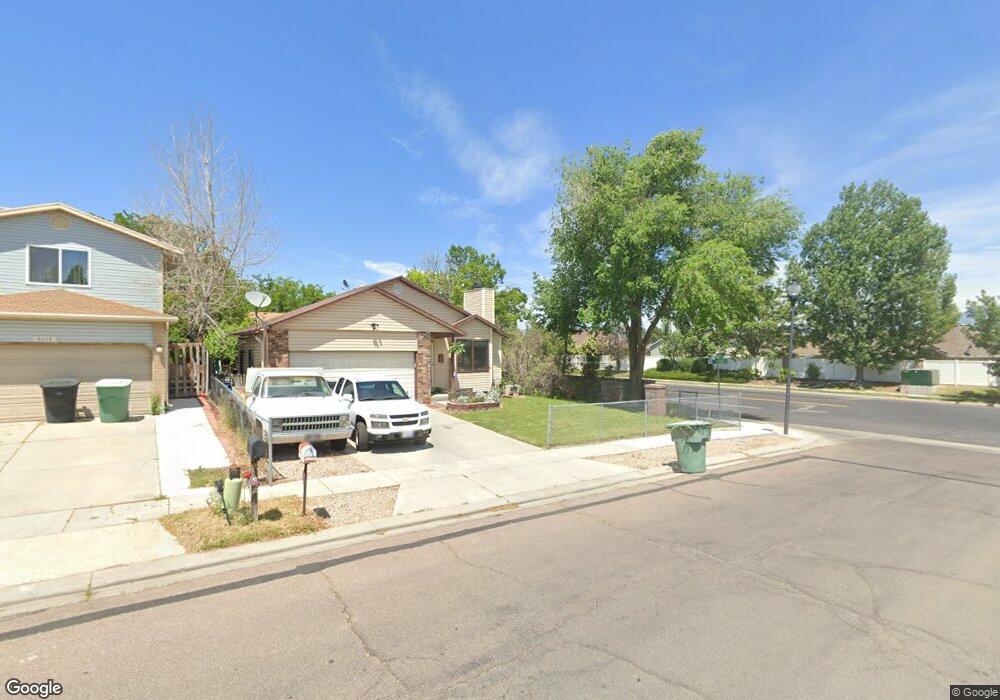
4886 Wake Robin Dr West Jordan, UT 84081
Oquirrh NeighborhoodEstimated Value: $454,000 - $476,000
5
Beds
2
Baths
2,118
Sq Ft
$220/Sq Ft
Est. Value
About This Home
This home is located at 4886 Wake Robin Dr, West Jordan, UT 84081 and is currently estimated at $465,701, approximately $219 per square foot. 4886 Wake Robin Dr is a home located in Salt Lake County with nearby schools including Mountain Shadows School, West Hills Middle School, and Copper Hills High School.
Ownership History
Date
Name
Owned For
Owner Type
Purchase Details
Closed on
Jan 12, 1999
Sold by
Romney Edward C and Romney Lynnette N
Bought by
Gunnell Gavin L
Current Estimated Value
Home Financials for this Owner
Home Financials are based on the most recent Mortgage that was taken out on this home.
Original Mortgage
$126,990
Outstanding Balance
$29,201
Interest Rate
6.66%
Mortgage Type
VA
Estimated Equity
$436,500
Purchase Details
Closed on
Nov 19, 1998
Sold by
Despain Jeremy W and Despain Christine
Bought by
Romney Edward C and Romney Lynnette N
Home Financials for this Owner
Home Financials are based on the most recent Mortgage that was taken out on this home.
Original Mortgage
$126,990
Outstanding Balance
$29,201
Interest Rate
6.66%
Mortgage Type
VA
Estimated Equity
$436,500
Purchase Details
Closed on
Feb 8, 1996
Sold by
Lopez Victor and Lopez Rebecca G
Bought by
Despain Jeremy W and Despain Christine
Home Financials for this Owner
Home Financials are based on the most recent Mortgage that was taken out on this home.
Original Mortgage
$102,800
Interest Rate
6.99%
Create a Home Valuation Report for This Property
The Home Valuation Report is an in-depth analysis detailing your home's value as well as a comparison with similar homes in the area
Home Values in the Area
Average Home Value in this Area
Purchase History
| Date | Buyer | Sale Price | Title Company |
|---|---|---|---|
| Gunnell Gavin L | -- | First American Title | |
| Romney Edward C | -- | -- | |
| Despain Jeremy W | -- | First American Title |
Source: Public Records
Mortgage History
| Date | Status | Borrower | Loan Amount |
|---|---|---|---|
| Open | Gunnell Gavin L | $126,990 | |
| Previous Owner | Despain Jeremy W | $102,800 |
Source: Public Records
Tax History Compared to Growth
Tax History
| Year | Tax Paid | Tax Assessment Tax Assessment Total Assessment is a certain percentage of the fair market value that is determined by local assessors to be the total taxable value of land and additions on the property. | Land | Improvement |
|---|---|---|---|---|
| 2025 | $2,389 | $427,600 | $104,500 | $323,100 |
| 2024 | $2,389 | $403,800 | $98,600 | $305,200 |
| 2023 | $2,388 | $379,300 | $94,800 | $284,500 |
| 2022 | $2,299 | $362,900 | $92,900 | $270,000 |
| 2021 | $2,014 | $295,200 | $71,400 | $223,800 |
| 2020 | $1,895 | $259,400 | $71,400 | $188,000 |
| 2019 | $1,850 | $247,700 | $67,400 | $180,300 |
| 2018 | $1,734 | $229,100 | $67,400 | $161,700 |
| 2017 | $1,569 | $204,200 | $67,400 | $136,800 |
| 2016 | $1,551 | $189,900 | $67,400 | $122,500 |
| 2015 | $1,408 | $166,300 | $64,600 | $101,700 |
| 2014 | $1,377 | $159,800 | $62,600 | $97,200 |
Source: Public Records
Map
Nearby Homes
- 4790 W Barletta Ct
- 4983 Shooting Star Ave
- 4891 Calyx Cir
- 4909 Sakura Ct
- 6811 S Etruscan Way
- 4785 Foggio Ct
- 4888 Ticklegrass Rd
- 6706 Marshrock Rd
- 6635 S Milfoil Cir
- 4763 W Arno Way
- 6900 S Florentine Way
- 5183 W Cadenza Dr
- 6437 S Lobelia Dr
- 6928 Beargrass Rd
- 6983 Florentine Way
- 6568 S 5180 W
- 6398 S Lobelia Dr
- 7071 S Kristilyn Ln
- 5281 Saguaro Dr
- 7093 S Greensand Dr
- 4894 W Wake Robin Dr
- 4894 Wake Robin Dr
- 4902 Wake Robin Dr
- 4885 Roundstem Rd
- 4902 W Wake Robin Dr
- 4897 Roundstem Rd
- 4908 Wake Robin Dr
- 6737 S Shooting Star Ave
- 6737 Shooting Star Ave
- 4908 W Wake Robin Dr
- 4852 W Majestic Loop Rd
- 4905 Roundstem Rd
- 4852 W Majestic Loop Rd
- 4863 W Roundstem Rd
- 4863 Roundstem Rd
- 6718 S Majestic Loop Rd
- 6713 Viburnum Ave
- 6718 Majestic Loop Rd
- 6743 Shooting Star Ave
- 6713 S Viburnum Ave