Estimated Value: $292,000 - $438,000
2
Beds
1
Bath
1,080
Sq Ft
$336/Sq Ft
Est. Value
About This Home
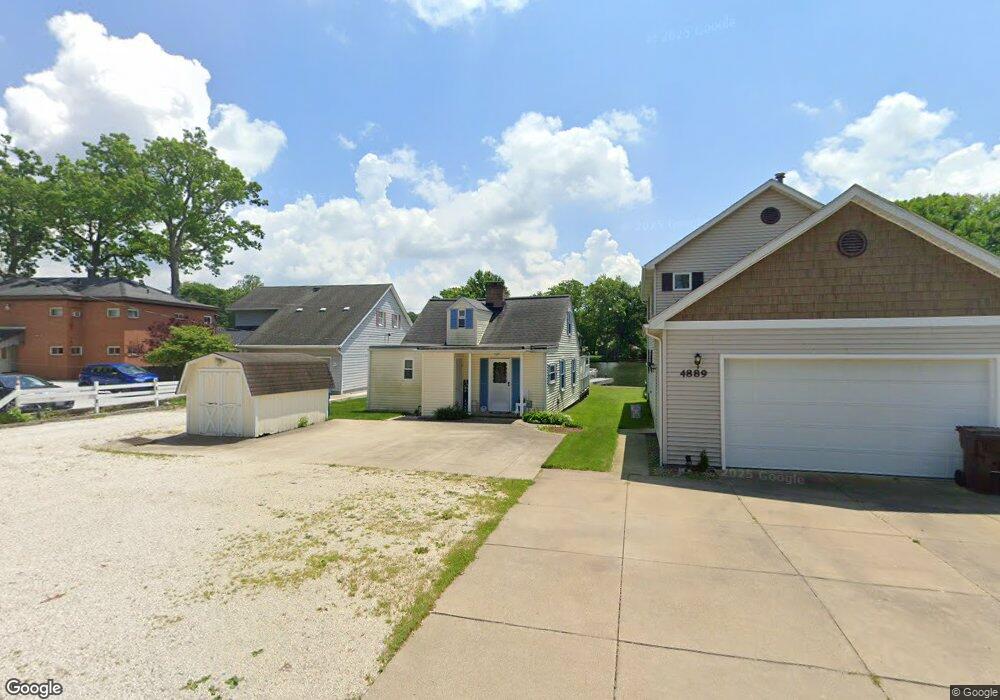
This home is located at 4887 Coleman Dr, Akron, OH 44319 and is currently estimated at $362,478, approximately $335 per square foot. 4887 Coleman Dr is a home located in Summit County with nearby schools including Nolley Elementary School, Manchester Middle School, and Manchester High School.
Ownership History
Date
Name
Owned For
Owner Type
Purchase Details
Closed on
Jan 3, 2024
Sold by
Gesaman Candice L and Gesaman Timothy R
Bought by
Tc Company Ltd
Current Estimated Value
Purchase Details
Closed on
Jan 2, 2024
Sold by
Candice L Gesaman Trust
Bought by
Gesaman Candice L and Gesaman Timothy R
Purchase Details
Closed on
Jan 3, 2011
Sold by
Gesaman Krista M
Bought by
Gesaman Candice L and Candice L Gesaman Trust
Purchase Details
Closed on
May 6, 2010
Sold by
Moser James R and Moser Joan A
Bought by
Gesaman Krista M
Purchase Details
Closed on
Nov 10, 1998
Sold by
Lane John T and Lane Judith M
Bought by
Moser James R and Morser Joan A
Home Financials for this Owner
Home Financials are based on the most recent Mortgage that was taken out on this home.
Original Mortgage
$100,000
Interest Rate
6.37%
Mortgage Type
Purchase Money Mortgage
Create a Home Valuation Report for This Property
The Home Valuation Report is an in-depth analysis detailing your home's value as well as a comparison with similar homes in the area
Home Values in the Area
Average Home Value in this Area
Purchase History
| Date | Buyer | Sale Price | Title Company |
|---|---|---|---|
| Tc Company Ltd | -- | None Listed On Document | |
| Ckwk Company Llc | -- | None Listed On Document | |
| Gesaman Candice L | -- | None Listed On Document | |
| Gesaman Candice L | -- | Attorney | |
| Gesaman Krista M | $171,000 | Lawyers Title-Akron | |
| Moser James R | $125,000 | -- |
Source: Public Records
Mortgage History
| Date | Status | Borrower | Loan Amount |
|---|---|---|---|
| Previous Owner | Moser James R | $100,000 |
Source: Public Records
Tax History Compared to Growth
Tax History
| Year | Tax Paid | Tax Assessment Tax Assessment Total Assessment is a certain percentage of the fair market value that is determined by local assessors to be the total taxable value of land and additions on the property. | Land | Improvement |
|---|---|---|---|---|
| 2025 | $4,995 | $98,102 | $40,611 | $57,491 |
| 2024 | $4,995 | $98,102 | $40,611 | $57,491 |
| 2023 | $4,995 | $98,102 | $40,611 | $57,491 |
| 2022 | $4,277 | $65,577 | $27,073 | $38,504 |
| 2021 | $4,292 | $65,577 | $27,073 | $38,504 |
| 2020 | $4,225 | $65,570 | $27,070 | $38,500 |
| 2019 | $4,607 | $63,980 | $25,940 | $38,040 |
| 2018 | $3,988 | $63,980 | $25,940 | $38,040 |
| 2017 | $3,890 | $63,980 | $25,940 | $38,040 |
| 2016 | $3,844 | $56,540 | $25,940 | $30,600 |
| 2015 | $3,890 | $56,540 | $25,940 | $30,600 |
| 2014 | $3,862 | $56,540 | $25,940 | $30,600 |
| 2013 | $3,745 | $55,200 | $25,940 | $29,260 |
Source: Public Records
Map
Nearby Homes
- 4944 Coleman Dr
- S/L 14,15 Shakes Hotel Dr
- lot 8 Whyem Dr
- 7 Shrakes Hotel Dr
- 5 Shrakes Hotel Dr
- 6 Shrakes Hotel Dr
- 3 Shrakes Hotel Dr
- 4 Shrakes Hotel Dr
- 4881 S Main St
- 410 Silk Ct
- 4674 S Main St
- 4831 Christman Rd
- 5892 Woodward Dr
- 4298 S Main St Unit 4302
- 715 Highland Park Dr
- 4138 S Main St
- 4131 State Park Dr
- 0 W Turkeyfoot Lake Rd Unit 5157637
- 2 Starboard Cir Unit 77
- 68 Starboard Cir
- 4889 Coleman Dr
- 4883 Coleman Dr
- 4891 Coleman Dr
- 4868 Coleman Dr
- 4899 Coleman Dr
- 4899 Coleman Dr
- 4873 Coleman Dr
- 4907 Coleman Dr
- 4907 Coleman Dr
- 368 Temple Ave
- 372 Temple Ave
- 376 Temple Ave
- 4918 Coleman Dr
- 4923 Coleman Dr
- 4923 Coleman Dr
- 4876 Durbin Ave
- 4856 Coleman Dr
- 4874 Durbin Ave
- 4933 Coleman Dr
- 392 Temple Ave