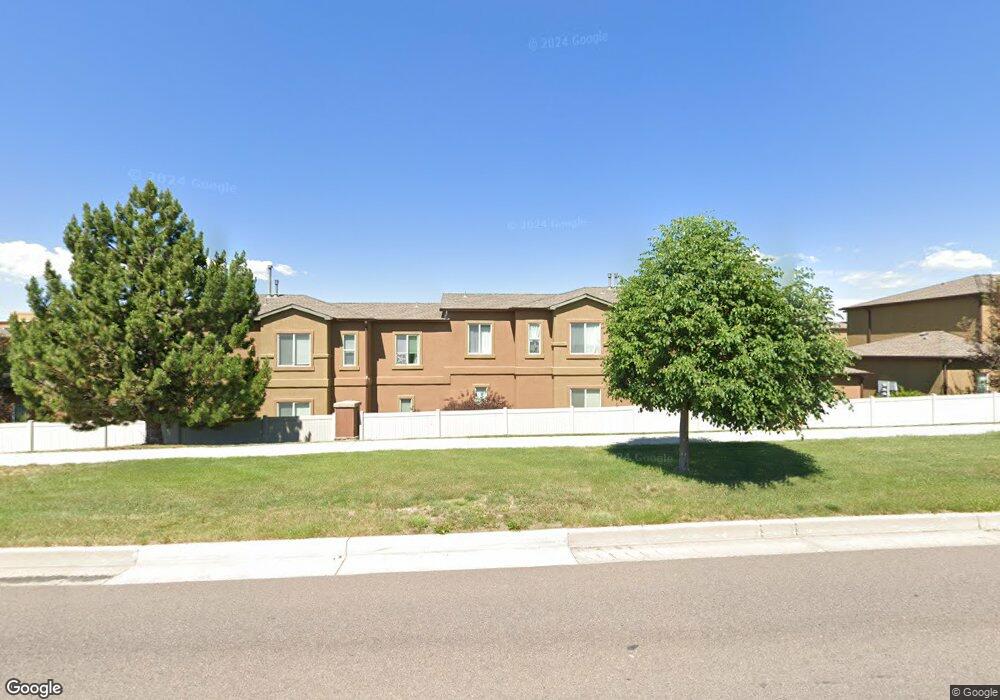
4888 Kerry Lynn View Unit 204 Colorado Springs, CO 80922
Springs Ranch NeighborhoodEstimated Value: $289,000 - $304,000
2
Beds
2
Baths
1,306
Sq Ft
$225/Sq Ft
Est. Value
About This Home
This home is located at 4888 Kerry Lynn View Unit 204, Colorado Springs, CO 80922 and is currently estimated at $294,361, approximately $225 per square foot. 4888 Kerry Lynn View Unit 204 is a home located in El Paso County with nearby schools including Springs Ranch Elementary School, Horizon Middle School, and Sand Creek High School.
Ownership History
Date
Name
Owned For
Owner Type
Purchase Details
Closed on
Sep 19, 2017
Sold by
Strawn Steven
Bought by
Strawn Holdings Llc
Current Estimated Value
Purchase Details
Closed on
Feb 20, 2017
Sold by
Norris Thomas H
Bought by
Strawn Steven
Home Financials for this Owner
Home Financials are based on the most recent Mortgage that was taken out on this home.
Original Mortgage
$106,000
Outstanding Balance
$87,566
Interest Rate
4.12%
Mortgage Type
New Conventional
Estimated Equity
$206,795
Purchase Details
Closed on
Mar 15, 2006
Sold by
Stetson 162 Llc
Bought by
Norris Thomas H
Home Financials for this Owner
Home Financials are based on the most recent Mortgage that was taken out on this home.
Original Mortgage
$154,828
Interest Rate
6.19%
Mortgage Type
VA
Create a Home Valuation Report for This Property
The Home Valuation Report is an in-depth analysis detailing your home's value as well as a comparison with similar homes in the area
Home Values in the Area
Average Home Value in this Area
Purchase History
| Date | Buyer | Sale Price | Title Company |
|---|---|---|---|
| Strawn Holdings Llc | -- | None Available | |
| Strawn Steven | $156,000 | Unified Title Co Inc | |
| Norris Thomas H | $151,600 | Stewart Title Of Co Inc |
Source: Public Records
Mortgage History
| Date | Status | Borrower | Loan Amount |
|---|---|---|---|
| Open | Strawn Steven | $106,000 | |
| Previous Owner | Norris Thomas H | $154,828 |
Source: Public Records
Tax History Compared to Growth
Tax History
| Year | Tax Paid | Tax Assessment Tax Assessment Total Assessment is a certain percentage of the fair market value that is determined by local assessors to be the total taxable value of land and additions on the property. | Land | Improvement |
|---|---|---|---|---|
| 2025 | $1,072 | $23,540 | -- | -- |
| 2024 | $973 | $20,940 | $4,290 | $16,650 |
| 2023 | $973 | $20,940 | $4,290 | $16,650 |
| 2022 | $941 | $15,140 | $2,710 | $12,430 |
| 2021 | $980 | $15,570 | $2,790 | $12,780 |
| 2020 | $826 | $12,980 | $2,150 | $10,830 |
| 2019 | $818 | $12,980 | $2,150 | $10,830 |
| 2018 | $734 | $11,430 | $1,690 | $9,740 |
| 2017 | $737 | $11,430 | $1,690 | $9,740 |
| 2016 | $667 | $10,200 | $1,590 | $8,610 |
| 2015 | $667 | $10,200 | $1,590 | $8,610 |
| 2014 | $680 | $10,200 | $1,590 | $8,610 |
Source: Public Records
Map
Nearby Homes
- 4604 Desert Varnish Dr
- 7010 Highcroft Dr
- 4632 Hidden River Dr
- 6980 Ashley Dr
- 4489 Crow Creek Dr
- 7120 Highcroft Dr
- 7084 Ash Creek Heights Unit 201
- 7104 Ash Creek Heights Unit 203
- 4529 Crow Creek Dr
- 7004 Ash Creek Heights Unit 201
- 6984 Ash Creek Heights Unit 204
- 4930 Townsend Dr
- 6925 Ash Creek Heights Unit 103
- 6835 Ashley Dr
- 4655 Vireos View
- 6825 Ashley Dr
- 4721 Falcons Hood Point
- 4741 Falcons Hood Point
- 4831 Desert Varnish Dr
- 6615 Annanhill Place
- 4888 Kerry Lynn View Unit 202
- 4888 Kerry Lynn View Unit 201
- 4888 Kerry Lynn View Unit 203
- 4888 Kerry Lynn View Unit 103
- 4888 Kerry Lynn View Unit 206
- 4888 Kerry Lynn View Unit 205
- 4888 Kerry Lynn View Unit 105
- 4888 Kerry Lynn Way Unit 101
- 4887 Kerry Lynn View Unit 202
- 4887 Kerry Lynn View Unit 201
- 4887 Kerry Lynn View Unit 101
- 4848 Kerry Lynn View Unit 206
- 4848 Kerry Lynn View Unit 205
- 4848 Kerry Lynn View Unit 105
- 4848 Kerry Lynn View Unit 204
- 4848 Kerry Lynn View Unit 203
- 4848 Kerry Lynn View Unit 103
- 4848 Kerry Lynn View Unit 202
- 4848 Kerry Lynn View Unit 201
- 4848 Kerry Lynn View Unit 101