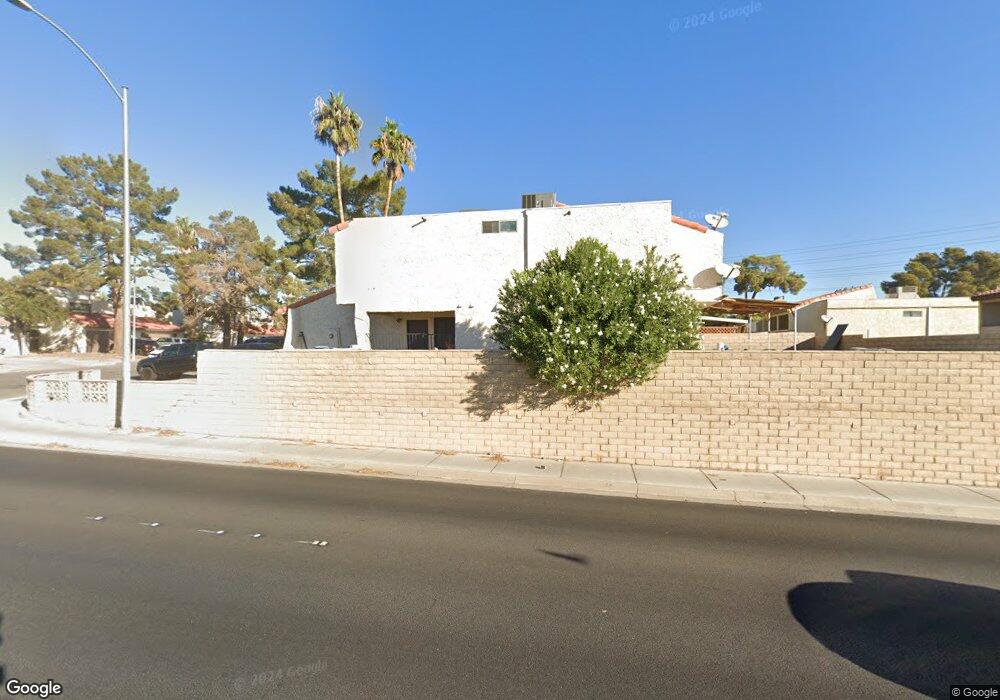
4888 Rollingwood Cir Las Vegas, NV 89121
Paradise Valley East NeighborhoodEstimated Value: $289,768 - $329,000
3
Beds
3
Baths
1,662
Sq Ft
$183/Sq Ft
Est. Value
About This Home
This home is located at 4888 Rollingwood Cir, Las Vegas, NV 89121 and is currently estimated at $303,442, approximately $182 per square foot. 4888 Rollingwood Cir is a home located in Clark County with nearby schools including William E. Ferron Elementary School, C.W. Woodbury Middle School, and Chaparral High School.
Ownership History
Date
Name
Owned For
Owner Type
Purchase Details
Closed on
Dec 1, 2018
Sold by
Kirkpatrick Victoria C
Bought by
Kirkpatrick Victoria C and The Victoria Kirkpatrick Family Trust
Current Estimated Value
Purchase Details
Closed on
May 28, 2009
Sold by
Jp Morgan Chase Bank National Associatio
Bought by
Kirkpatrick Victoria C
Purchase Details
Closed on
Dec 5, 2008
Sold by
Benel Guillermo and Benel Elizabeth
Bought by
Jpmorgan Chase Bank National Association
Purchase Details
Closed on
Aug 1, 2000
Sold by
Engelstad Eileen
Bought by
Benel Guillermo and Benel Elizabeth
Home Financials for this Owner
Home Financials are based on the most recent Mortgage that was taken out on this home.
Original Mortgage
$114,059
Interest Rate
8.2%
Mortgage Type
FHA
Create a Home Valuation Report for This Property
The Home Valuation Report is an in-depth analysis detailing your home's value as well as a comparison with similar homes in the area
Home Values in the Area
Average Home Value in this Area
Purchase History
| Date | Buyer | Sale Price | Title Company |
|---|---|---|---|
| Kirkpatrick Victoria C | -- | Accommodation | |
| Kirkpatrick Victoria C | $53,000 | Servicelink Aliquippa | |
| Jpmorgan Chase Bank National Association | $140,867 | Fidelity National Default So | |
| Benel Guillermo | $115,000 | National Title Company |
Source: Public Records
Mortgage History
| Date | Status | Borrower | Loan Amount |
|---|---|---|---|
| Previous Owner | Benel Guillermo | $114,059 |
Source: Public Records
Tax History Compared to Growth
Tax History
| Year | Tax Paid | Tax Assessment Tax Assessment Total Assessment is a certain percentage of the fair market value that is determined by local assessors to be the total taxable value of land and additions on the property. | Land | Improvement |
|---|---|---|---|---|
| 2025 | $730 | $54,923 | $23,100 | $31,823 |
| 2024 | $676 | $54,923 | $23,100 | $31,823 |
| 2023 | $676 | $55,885 | $25,550 | $30,335 |
| 2022 | $626 | $52,241 | $22,750 | $29,491 |
| 2021 | $580 | $42,204 | $17,500 | $24,704 |
| 2020 | $536 | $40,245 | $14,000 | $26,245 |
| 2019 | $502 | $38,837 | $12,250 | $26,587 |
| 2018 | $479 | $40,631 | $14,700 | $25,931 |
| 2017 | $1,049 | $35,760 | $9,450 | $26,310 |
| 2016 | $450 | $32,809 | $5,250 | $27,559 |
| 2015 | $448 | $21,734 | $5,250 | $16,484 |
| 2014 | $434 | $14,348 | $5,250 | $9,098 |
Source: Public Records
Map
Nearby Homes
- 3994 Ridgewood Ave
- 3961 Acapulco Ave
- 3982 Acapulco Ave
- 4990 Spring Oak St Unit 4
- 3831 Calle de Benito
- 3917 Acapulco Ave
- 4095 Ridgewood Ave
- 5028 Meadow Grove Ct
- 4010 Syracuse Dr
- 3999 Meadow Grove Ave
- 3955 Ventura Way
- 4129 Ridgewood Ave
- 3959 Briarcrest Ct
- 3912 Ventura Way
- 3690 La Junta Dr
- 4161 Oxnard Cir
- 5141 Shadow Hill Dr
- 5102 Tennis Ct E
- 3846 Syracuse Dr
- 5243 Sunnywood Dr
- 4882 Rollingwood Cir
- 4876 Rollingwood Cir
- 4887 Joplin Cir
- 4881 Joplin Cir
- 4870 Rollingwood Cir
- 4875 Joplin Cir
- 4867 Joplin Cir
- 4864 Rollingwood Cir
- 4889 Rollingwood Cir
- 4883 Rollingwood Cir
- 4855 Joplin Cir
- 3984 Ridgewood Ave
- 4858 Rollingwood Cir
- 4877 Rollingwood Cir
- 4871 Rollingwood Cir
- 4852 Rollingwood Cir
- 4847 Joplin Cir
- 4004 Ridgewood Ave
- 4865 Rollingwood Cir
- 3968 Almondwood Dr