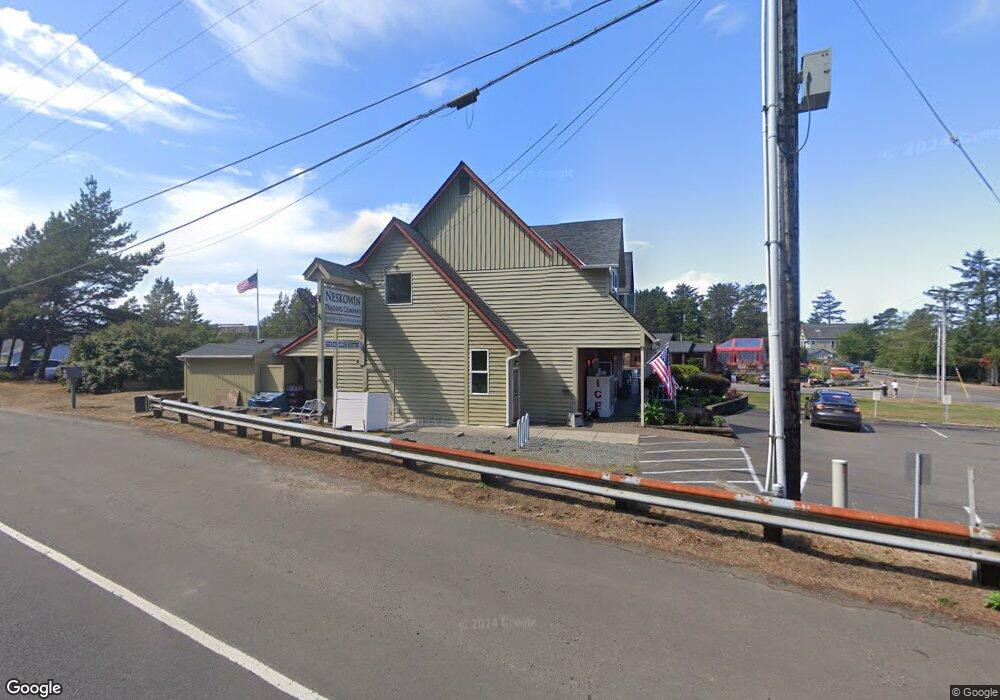
48880 U S 101 S Neskowin, OR 97149
Estimated Value: $1,744,898
--
Bed
3
Baths
5,158
Sq Ft
$338/Sq Ft
Est. Value
About This Home
This home is located at 48880 U S 101 S, Neskowin, OR 97149 and is currently estimated at $1,744,898, approximately $338 per square foot. 48880 U S 101 S is a home located in Tillamook County with nearby schools including Nestucca K-8 School and Nestucca High School.
Ownership History
Date
Name
Owned For
Owner Type
Purchase Details
Closed on
Aug 27, 2021
Sold by
Herbel Michael C and Herbel Kimberley S
Bought by
Communitees Provisions Llc
Current Estimated Value
Home Financials for this Owner
Home Financials are based on the most recent Mortgage that was taken out on this home.
Original Mortgage
$1,110,000
Outstanding Balance
$694,643
Interest Rate
2.17%
Estimated Equity
$1,050,255
Purchase Details
Closed on
Jun 12, 2015
Sold by
Herbel Michael
Bought by
Herbel Michael C and Herbel Kimberley S
Home Financials for this Owner
Home Financials are based on the most recent Mortgage that was taken out on this home.
Original Mortgage
$645,000
Interest Rate
3.77%
Mortgage Type
Credit Line Revolving
Purchase Details
Closed on
Nov 22, 2010
Sold by
Haruda Fred D
Bought by
Kent A Poelman Company
Home Financials for this Owner
Home Financials are based on the most recent Mortgage that was taken out on this home.
Original Mortgage
$80,000
Interest Rate
4.18%
Mortgage Type
New Conventional
Create a Home Valuation Report for This Property
The Home Valuation Report is an in-depth analysis detailing your home's value as well as a comparison with similar homes in the area
Home Values in the Area
Average Home Value in this Area
Purchase History
| Date | Buyer | Sale Price | Title Company |
|---|---|---|---|
| Communitees Provisions Llc | $1,480,000 | Ticor Title | |
| Herbel Michael C | -- | None Available | |
| Kent A Poelman Company | $865,000 | First American |
Source: Public Records
Mortgage History
| Date | Status | Borrower | Loan Amount |
|---|---|---|---|
| Open | Communitees Provisions Llc | $1,110,000 | |
| Previous Owner | Herbel Michael C | $645,000 | |
| Previous Owner | Kent A Poelman Company | $80,000 | |
| Previous Owner | Kent A Poelman Company | $705,000 |
Source: Public Records
Tax History Compared to Growth
Tax History
| Year | Tax Paid | Tax Assessment Tax Assessment Total Assessment is a certain percentage of the fair market value that is determined by local assessors to be the total taxable value of land and additions on the property. | Land | Improvement |
|---|---|---|---|---|
| 2024 | $11,726 | $948,010 | $402,960 | $545,050 |
| 2023 | $11,754 | $920,400 | $391,220 | $529,180 |
| 2022 | $11,336 | $893,600 | $379,820 | $513,780 |
| 2021 | $11,017 | $867,580 | $368,760 | $498,820 |
| 2020 | $10,342 | $810,660 | $358,020 | $452,640 |
| 2019 | $10,003 | $777,530 | $347,590 | $429,940 |
| 2018 | $9,235 | $754,890 | $337,460 | $417,430 |
| 2017 | $8,114 | $732,910 | $327,630 | $405,280 |
| 2016 | $7,446 | $709,970 | $327,630 | $382,340 |
| 2015 | $9,289 | $721,790 | $327,630 | $394,160 |
| 2014 | $10,288 | $729,730 | $194,350 | $535,380 |
| 2013 | -- | $677,700 | $188,690 | $489,010 |
Source: Public Records
Map
Nearby Homes
- 48988 Highway 101 S Unit 338
- 48988 Highway 101 S Unit 137-F
- 49002 S Hwy Unit B share B
- 49002 U S 101 S
- 4800 Blk Valley View Dr Tl 4000
- 48988 S Highway 101 (#338) Hwy
- 6600 Schoolhouse Rd
- 4850 Schoolhouse Rd
- 48250 Hawk St
- 0 Hilltop Ln Unit 704164730
- 49400 Blk Nescove Dr Tl303
- TL 3102 S Beach Rd
- 3102 S Beach Rd
- 0 S Fairway Rd Unit 653571953
- 0 S Fairway Rd Unit 315656510
- 0 S Fairway Rd Unit 454757988
- 49750 Nescove Dr
- 49855 Seasand Rd
- 50040 S Beach Rd
- TL 4400 Rocky Cove Way
- 49008 S Us-101 E Share H
- 48988 U S 101 S Unit 332
- 48988 U S 101 S Unit 236
- 48988 U S 101 S Unit 226
- 48988 U S 101 S Unit 227
- 48988 U S 101 S Unit 130
- 48988 U S 101 S Unit 338F
- 48988 U S 101 S Unit 232
- 48988 U S 101 S Unit 140
- 48988 U S 101 S Unit 129
- 48988 U S 101 S Unit 126
- 48988 U S 101 S Unit 341
- 48988 U S 101 S
- 219 S Beach Rd
- 48988 U S 101 Unit 132
- 48988 U S 101
- 48988 Us-101 Unit 240
- 48988 Us-101 Unit 322
- 48988 Us-101 Unit 233
- 45057 Salem Ave