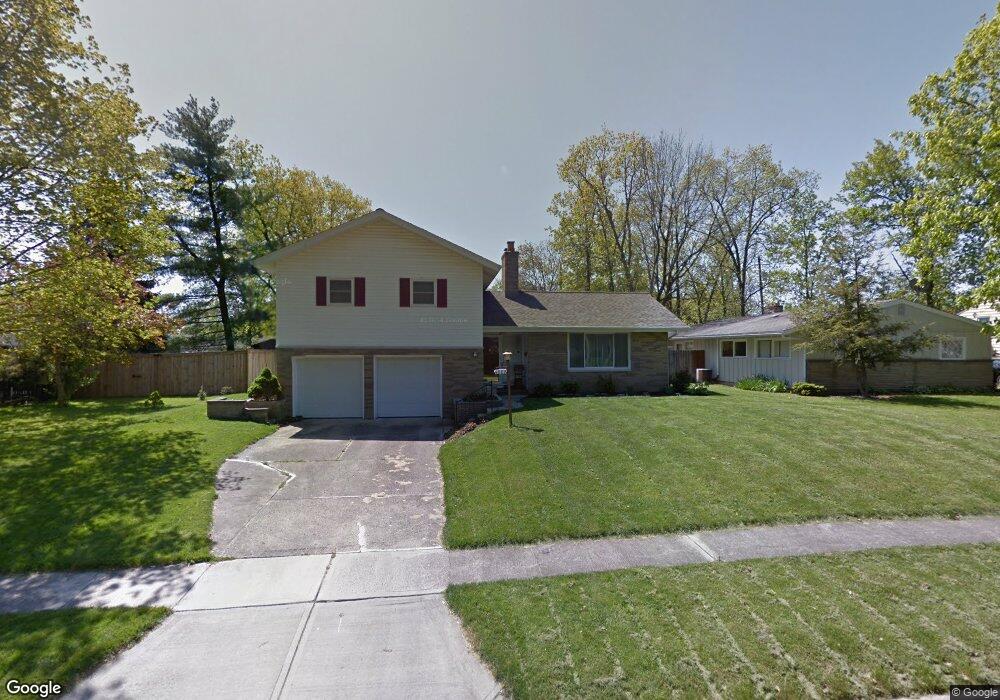
4889 Hamden Way Columbus, OH 43228
Estimated Value: $258,000 - $269,000
3
Beds
3
Baths
1,886
Sq Ft
$140/Sq Ft
Est. Value
About This Home
This home is located at 4889 Hamden Way, Columbus, OH 43228 and is currently estimated at $263,794, approximately $139 per square foot. 4889 Hamden Way is a home located in Franklin County with nearby schools including Prairie Lincoln Elementary School, Galloway Ridge Intermediate School, and Norton Middle School.
Ownership History
Date
Name
Owned For
Owner Type
Purchase Details
Closed on
Oct 9, 2002
Sold by
Schiller Dean C and Schiller Jill
Bought by
Miller Michael G and Weaver Daryl E
Current Estimated Value
Home Financials for this Owner
Home Financials are based on the most recent Mortgage that was taken out on this home.
Original Mortgage
$116,850
Outstanding Balance
$47,586
Interest Rate
6.29%
Mortgage Type
Purchase Money Mortgage
Estimated Equity
$216,208
Purchase Details
Closed on
Aug 22, 2002
Sold by
Estate Of Elizabeth M Schiller
Bought by
Schiller Dean C
Home Financials for this Owner
Home Financials are based on the most recent Mortgage that was taken out on this home.
Original Mortgage
$116,850
Outstanding Balance
$47,586
Interest Rate
6.29%
Mortgage Type
Purchase Money Mortgage
Estimated Equity
$216,208
Purchase Details
Closed on
Jul 5, 2002
Sold by
Estate Of Elizabeth Shiller
Bought by
Shiller Dean C
Purchase Details
Closed on
Aug 5, 1980
Bought by
Schiller Carl W
Create a Home Valuation Report for This Property
The Home Valuation Report is an in-depth analysis detailing your home's value as well as a comparison with similar homes in the area
Home Values in the Area
Average Home Value in this Area
Purchase History
| Date | Buyer | Sale Price | Title Company |
|---|---|---|---|
| Miller Michael G | $123,000 | -- | |
| Schiller Dean C | -- | -- | |
| Shiller Dean C | -- | -- | |
| Schiller Carl W | $67,500 | -- |
Source: Public Records
Mortgage History
| Date | Status | Borrower | Loan Amount |
|---|---|---|---|
| Open | Miller Michael G | $116,850 |
Source: Public Records
Tax History
| Year | Tax Paid | Tax Assessment Tax Assessment Total Assessment is a certain percentage of the fair market value that is determined by local assessors to be the total taxable value of land and additions on the property. | Land | Improvement |
|---|---|---|---|---|
| 2025 | $3,605 | $79,280 | $20,230 | $59,050 |
| 2024 | $3,605 | $79,280 | $20,230 | $59,050 |
| 2023 | $3,450 | $79,275 | $20,230 | $59,045 |
| 2022 | $2,852 | $45,920 | $4,410 | $41,510 |
| 2021 | $2,898 | $45,920 | $4,410 | $41,510 |
| 2020 | $2,874 | $45,920 | $4,410 | $41,510 |
| 2019 | $2,817 | $39,310 | $3,710 | $35,600 |
| 2018 | $2,721 | $39,310 | $3,710 | $35,600 |
| 2017 | $2,658 | $39,310 | $3,710 | $35,600 |
| 2016 | $2,634 | $35,560 | $7,210 | $28,350 |
| 2015 | $2,633 | $35,560 | $7,210 | $28,350 |
| 2014 | $2,599 | $35,560 | $7,210 | $28,350 |
| 2013 | $1,598 | $41,825 | $8,470 | $33,355 |
Source: Public Records
Map
Nearby Homes
- 399 Carilla Ln
- 480 Yarmouth Ln
- 329 Weymouth Ln
- 381 Pasadena Ave
- 404 Old Village Rd
- 218 Darbyhurst Rd
- 129 Beacon Run W Unit 21C
- 87 Tarryton Ct W Unit 18D
- 4723 Tarryton Ct S Unit 14-E
- 89 Postle Blvd
- 104 Oxley Rd
- 110 Inah Ave
- 4637 Hilton Ave
- 69 Lawrence Ave
- 4682 Arnold Ave
- 4647 Henley Ave
- 5409 Longworth Dr
- 257 S Murray Hill Rd
- 5648 Larksdale Dr
- 377 S Murray Hill Rd
- 4899 Hamden Way
- 445 N Murray Hill Rd
- 435 N Murray Hill Rd
- 4890 Malden Way
- 4909 Hamden Way
- 4900 Malden Way
- 4880 Malden Way
- 4890 Hamden Way
- 4880 Hamden Way
- 4898 Hamden Way
- 4908 Malden Way
- 4915 Hamden Way
- 4908 Hamden Way
- 4916 Malden Way
- 473 N Murray Hill Rd
- 4923 Hamden Way
- 4916 Hamden Way
- 475 Darbyhurst Rd
- 436 N Murray Hill Rd
- 4924 Malden Way
Your Personal Tour Guide
Ask me questions while you tour the home.