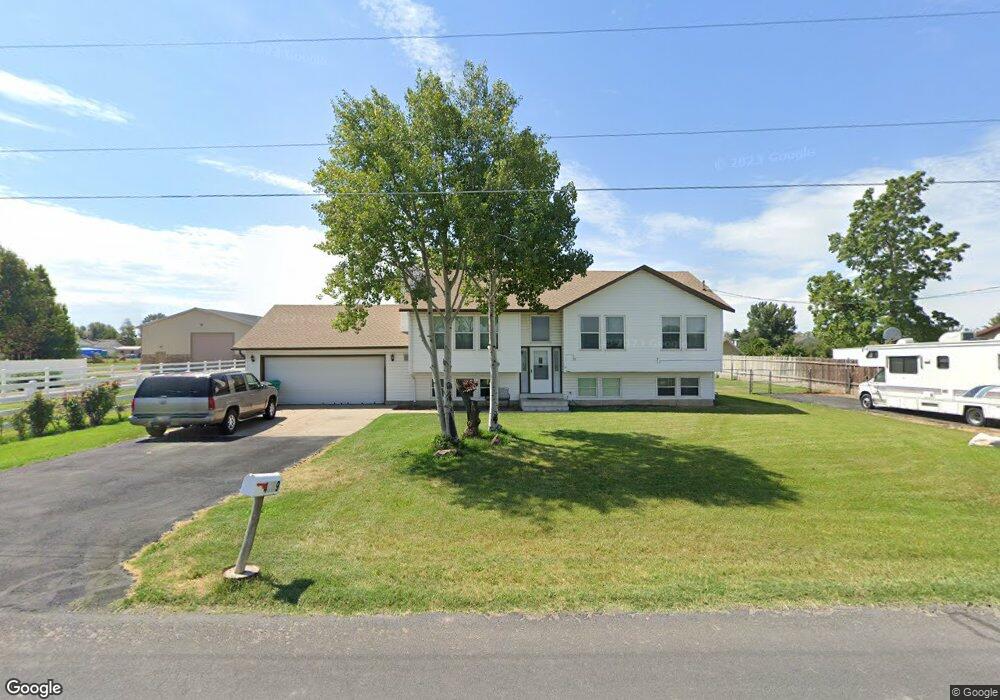
4889 W 800 N Clearfield, UT 84015
Estimated Value: $570,000 - $618,000
5
Beds
3
Baths
2,364
Sq Ft
$252/Sq Ft
Est. Value
About This Home
This home is located at 4889 W 800 N, Clearfield, UT 84015 and is currently estimated at $596,722, approximately $252 per square foot. 4889 W 800 N is a home located in Davis County with nearby schools including West Point School, West Point Junior High School, and Syracuse High School.
Ownership History
Date
Name
Owned For
Owner Type
Purchase Details
Closed on
Jul 14, 2016
Sold by
Smith Lujeanc
Bought by
Scabrough Michael D and Scabrough Sharon
Current Estimated Value
Purchase Details
Closed on
May 17, 2012
Sold by
Smith Lujean C
Bought by
Smith Lujean C
Purchase Details
Closed on
Jun 24, 2009
Sold by
Mccormick James R and Mccormick Bonita A
Bought by
Smith Lujean C
Home Financials for this Owner
Home Financials are based on the most recent Mortgage that was taken out on this home.
Original Mortgage
$155,000
Interest Rate
4.48%
Mortgage Type
Purchase Money Mortgage
Purchase Details
Closed on
Jun 27, 1997
Sold by
Hinz Rebecca J
Bought by
Mccormick James R and Mccormick Bonita A
Home Financials for this Owner
Home Financials are based on the most recent Mortgage that was taken out on this home.
Original Mortgage
$96,000
Interest Rate
7.91%
Create a Home Valuation Report for This Property
The Home Valuation Report is an in-depth analysis detailing your home's value as well as a comparison with similar homes in the area
Home Values in the Area
Average Home Value in this Area
Purchase History
| Date | Buyer | Sale Price | Title Company |
|---|---|---|---|
| Scabrough Michael D | -- | Us Title | |
| Smith Lujean C | -- | None Available | |
| Smith Lujean C | -- | First American Title | |
| Mccormick James R | -- | Western States Title Company |
Source: Public Records
Mortgage History
| Date | Status | Borrower | Loan Amount |
|---|---|---|---|
| Previous Owner | Smith Lujean C | $155,000 | |
| Previous Owner | Mccormick James R | $96,000 |
Source: Public Records
Tax History
| Year | Tax Paid | Tax Assessment Tax Assessment Total Assessment is a certain percentage of the fair market value that is determined by local assessors to be the total taxable value of land and additions on the property. | Land | Improvement |
|---|---|---|---|---|
| 2025 | -- | $306,350 | $171,288 | $135,062 |
| 2024 | -- | $289,850 | $153,844 | $136,006 |
| 2023 | $2,182 | $493,000 | $215,085 | $277,915 |
| 2022 | $2,182 | $288,200 | $118,979 | $169,221 |
| 2021 | $1,765 | $396,000 | $159,587 | $236,413 |
| 2020 | $2,526 | $346,000 | $138,583 | $207,417 |
| 2019 | $2,490 | $336,000 | $133,091 | $202,909 |
| 2018 | $2,325 | $309,000 | $123,476 | $185,524 |
| 2016 | $1,994 | $138,985 | $48,184 | $90,801 |
| 2015 | $1,940 | $128,150 | $48,184 | $79,966 |
| 2014 | $1,883 | $125,884 | $48,184 | $77,700 |
| 2013 | -- | $97,039 | $32,457 | $64,582 |
Source: Public Records
Map
Nearby Homes
- 4901 W 650 N
- 1156 N 5150 W
- 477 N 4500 W
- 4928 W Eagles Landing
- 113 N 4950 W
- 4669 W 75 N
- 4857 Pintail Way
- 4817 W 50 S
- 4358 West St Unit 105
- 1480 N 4300 W
- 3902 W 825 N
- 4396 W 1825 N Unit 112
- 4382 W 1825 N Unit 110
- 4362 W 1825 N Unit 106
- 4354 W 1825 N Unit 104
- 4348 W 1825 N Unit 103
- 4344 W 1825 N Unit 102
- 356 S 4300 W Unit 611
- 148 N 3830 W
- 4260 W 350 S
Your Personal Tour Guide
Ask me questions while you tour the home.