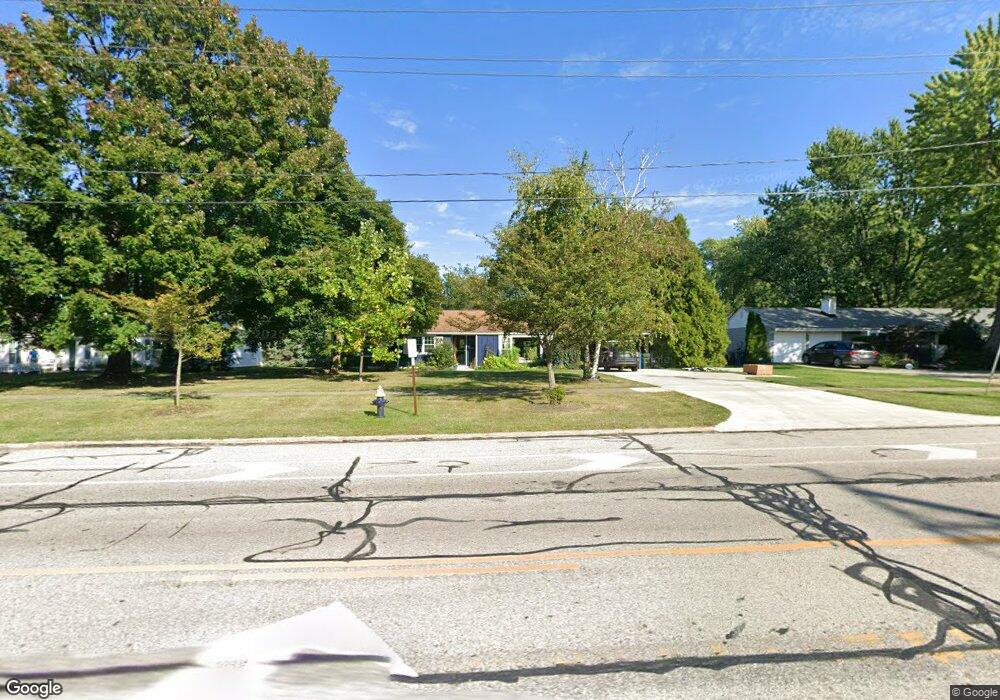
489 Clague Rd Bay Village, OH 44140
Estimated Value: $330,000 - $392,000
3
Beds
2
Baths
1,536
Sq Ft
$231/Sq Ft
Est. Value
About This Home
This home is located at 489 Clague Rd, Bay Village, OH 44140 and is currently estimated at $354,639, approximately $230 per square foot. 489 Clague Rd is a home located in Cuyahoga County with nearby schools including Normandy Elementary School, Westerly Elementary School, and Bay Middle School.
Ownership History
Date
Name
Owned For
Owner Type
Purchase Details
Closed on
Nov 16, 2016
Sold by
Doyle Deborah A and Scino Laurel Lynn
Bought by
Huber Jesse L
Current Estimated Value
Home Financials for this Owner
Home Financials are based on the most recent Mortgage that was taken out on this home.
Original Mortgage
$106,560
Outstanding Balance
$85,549
Interest Rate
3.42%
Mortgage Type
New Conventional
Estimated Equity
$269,090
Purchase Details
Closed on
Nov 7, 2012
Sold by
Doyle Deborah A and Scinto Laurel Lynn
Bought by
Doyle Deborah A and Scinto Laurel Lynn
Purchase Details
Closed on
Feb 14, 2002
Sold by
Delamater Robert T and Delamater Ethel May
Bought by
Delamater Robert T and Delamater Ethel May
Purchase Details
Closed on
Mar 29, 1985
Sold by
Delamater Robt T and E M
Bought by
Delamater Robert T
Purchase Details
Closed on
Jan 1, 1975
Bought by
Delamater Robt T and E M
Create a Home Valuation Report for This Property
The Home Valuation Report is an in-depth analysis detailing your home's value as well as a comparison with similar homes in the area
Home Values in the Area
Average Home Value in this Area
Purchase History
| Date | Buyer | Sale Price | Title Company |
|---|---|---|---|
| Huber Jesse L | $120,000 | None Available | |
| Doyle Deborah A | -- | Attorney | |
| Delamater Robert T | -- | -- | |
| Delamater Robert T | -- | -- | |
| Delamater Robt T | -- | -- |
Source: Public Records
Mortgage History
| Date | Status | Borrower | Loan Amount |
|---|---|---|---|
| Open | Huber Jesse L | $106,560 |
Source: Public Records
Tax History Compared to Growth
Tax History
| Year | Tax Paid | Tax Assessment Tax Assessment Total Assessment is a certain percentage of the fair market value that is determined by local assessors to be the total taxable value of land and additions on the property. | Land | Improvement |
|---|---|---|---|---|
| 2024 | $5,694 | $82,250 | $23,450 | $58,800 |
| 2023 | $5,181 | $63,430 | $17,330 | $46,100 |
| 2022 | $5,157 | $63,420 | $17,325 | $46,095 |
| 2021 | $4,687 | $63,420 | $17,330 | $46,100 |
| 2020 | $4,454 | $54,220 | $14,810 | $39,410 |
| 2019 | $4,314 | $154,400 | $42,300 | $112,100 |
| 2018 | $3,474 | $54,040 | $14,810 | $39,240 |
| 2017 | $3,796 | $42,010 | $12,360 | $29,650 |
| 2016 | $3,678 | $42,010 | $12,360 | $29,650 |
| 2015 | $4,219 | $51,700 | $12,360 | $39,340 |
| 2014 | $4,068 | $47,890 | $11,450 | $36,440 |
Source: Public Records
Map
Nearby Homes
- 421 Darbys Run
- 24014 Wolf Rd
- 23200 Lake Rd Unit 50
- 23200 Lake Rd Unit 47
- 23200 Lake Rd Unit 30
- 561 Upland Rd
- 22722 Lake Rd
- 22728 Lake Rd
- 7 Pond Dr
- 24411 E Oakland Rd
- 22700 Lake Rd Unit 204
- 22700 Lake Rd Unit 305
- 22700 Lake Rd Unit 406
- 22700 Lake Rd Unit 306
- 22700 Lake Rd Unit 405
- 22700 Lake Rd Unit 304
- 22700 Lake Rd Unit 504
- 22700 Lake Rd Unit 102
- 24434 Lake Rd
- 700 Brick Mill Run Unit 406
- 485 Clague Rd
- 495 Clague Rd
- 486 Queenswood Dr
- 496 Queenswood Dr
- 501 Clague Rd
- 463 Clague Rd
- 23706 Russell Rd
- 464 Queenswood Dr
- 488 Clague Rd
- V/L Clague Rd
- 486 Clague Rd
- 23710 Russell Rd
- 502 Queenswood Dr
- 484 Clague Rd
- 453 Clague Rd
- 23714 Russell Rd
- 452 Queenswood Dr
- 462 Clague Rd
- 487 Queenswood Dr
- 463 Queenswood Dr