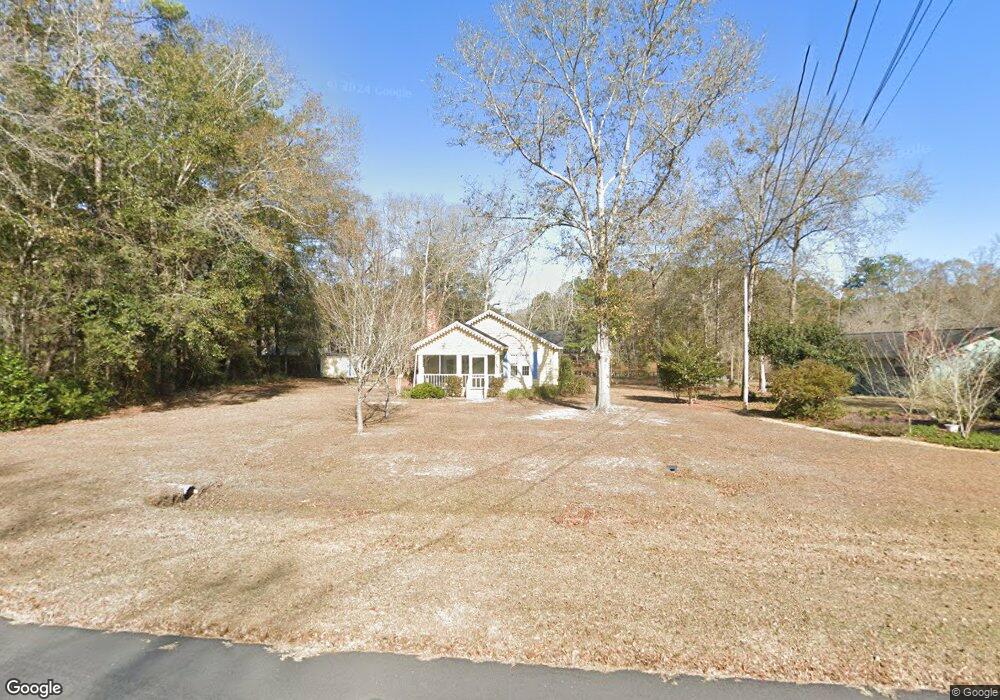
489 Doe Run Cir Thomasville, GA 31757
Estimated Value: $204,956 - $270,000
3
Beds
2
Baths
1,880
Sq Ft
$125/Sq Ft
Est. Value
About This Home
This home is located at 489 Doe Run Cir, Thomasville, GA 31757 and is currently estimated at $235,739, approximately $125 per square foot. 489 Doe Run Cir is a home located in Thomas County with nearby schools including Hand in Hand Primary School, Cross Creek Elementary School, and Garrison-Pilcher Elementary School.
Ownership History
Date
Name
Owned For
Owner Type
Purchase Details
Closed on
Aug 20, 2015
Sold by
Thompson Jay W
Bought by
Thompson Jay W and Sexton Margaret Carol Allen
Current Estimated Value
Purchase Details
Closed on
Oct 22, 2004
Sold by
Whiddon Brett L
Bought by
Thompson Thompson J and Thompson Barbara W
Purchase Details
Closed on
Jul 1, 2004
Sold by
Smith Lee
Bought by
Whiddon Brett L
Purchase Details
Closed on
Aug 29, 2003
Sold by
Lee Patricia Benton and Lee Sophia A
Bought by
Smith Lee
Purchase Details
Closed on
Mar 28, 2003
Sold by
Thomas County F S & L A
Bought by
Lee Patricia Benton and Lee Sophia A
Purchase Details
Closed on
Nov 5, 2002
Sold by
Lee Gordon R
Bought by
Thomas County F S & L A
Purchase Details
Closed on
Mar 31, 1984
Bought by
Lee Gordon R
Create a Home Valuation Report for This Property
The Home Valuation Report is an in-depth analysis detailing your home's value as well as a comparison with similar homes in the area
Home Values in the Area
Average Home Value in this Area
Purchase History
| Date | Buyer | Sale Price | Title Company |
|---|---|---|---|
| Thompson Jay W | -- | -- | |
| Thompson Thompson J | $132,500 | -- | |
| Whiddon Brett L | $107,000 | -- | |
| Smith Lee | $35,000 | -- | |
| Lee Patricia Benton | $55,400 | -- | |
| Thomas County F S & L A | -- | -- | |
| Lee Gordon R | $6,500 | -- |
Source: Public Records
Tax History Compared to Growth
Tax History
| Year | Tax Paid | Tax Assessment Tax Assessment Total Assessment is a certain percentage of the fair market value that is determined by local assessors to be the total taxable value of land and additions on the property. | Land | Improvement |
|---|---|---|---|---|
| 2024 | $1,347 | $65,290 | $22,880 | $42,410 |
| 2023 | $1,226 | $60,850 | $20,800 | $40,050 |
| 2022 | $1,189 | $53,465 | $18,000 | $35,465 |
| 2021 | $1,179 | $48,128 | $18,000 | $30,128 |
| 2020 | $1,033 | $47,868 | $18,000 | $29,868 |
| 2019 | $1,044 | $47,868 | $18,000 | $29,868 |
| 2018 | $1,061 | $47,648 | $18,000 | $29,648 |
| 2017 | $1,034 | $45,984 | $16,020 | $29,964 |
| 2016 | $1,009 | $44,739 | $16,020 | $28,719 |
| 2015 | $1,066 | $46,327 | $14,940 | $31,387 |
| 2014 | $1,049 | $45,587 | $14,940 | $30,647 |
| 2013 | -- | $45,586 | $14,940 | $30,646 |
Source: Public Records
Map
Nearby Homes
- 8805 Georgia 202
- 249 Longwood Dr
- 475 Longwood Dr
- 250 Knoll Rd
- 365 W Shore Dr
- 325 W Shore Dr
- 800 Westshore Dr
- 103 Mossy Creek Way
- 107 Mossy Creek Way
- 128 Quail Ridge St
- 110 Quail Ridge
- 7216 Ga Highway 202
- 7216 Georgia 202
- 10806 Georgia 202
- 101 Willow Ridge Cir
- 129 Willow Ridge Cir
- 900 Benton Rd
- 108 Willow Ridge Cir
- 110 Willow Ridge Cir
- 169 Willow Ridge Cir
- 499 Doe Run Cir
- 504 Doe Run Cir
- 463 Doe Run Cir
- 509 Doe Run Cir
- 451 Doe Run Cir
- 498 Doe Run Cir
- 486 Doe Run Cir
- 472 Doe Run Cir
- 531 Doe Run Cir
- 415 Doe Run Cir
- 516 Doe Run Cir
- 520 Doe Run Cir
- 450 Doe Run Cir
- 532 Doe Run Cir
- 571 Doe Run Cir
- 8971 Georgia 202
- 8971 Ga Hwy 202
- 8971 Ga Highway 202
- 574 Doe Run Cir
- 410 Longwood Dr