
489 E 3rd St Unit 2 Boston, MA 02127
South Boston Neighborhood
2
Beds
1
Bath
605
Sq Ft
610
Sq Ft Lot
About This Home
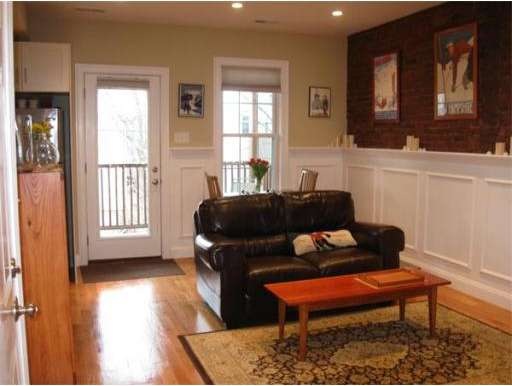
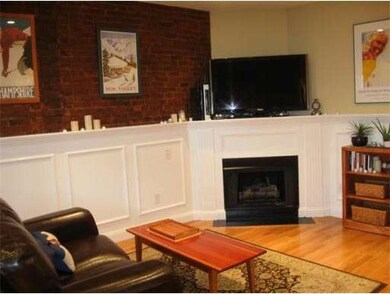
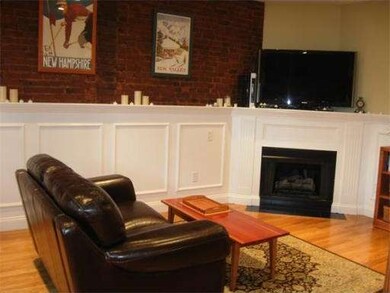
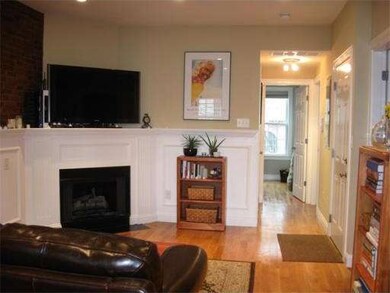
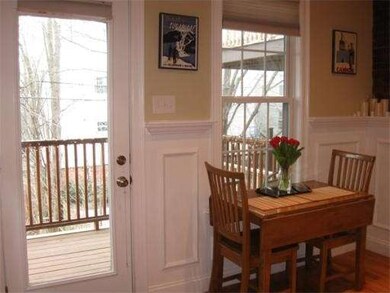
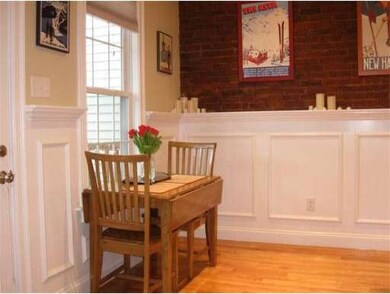
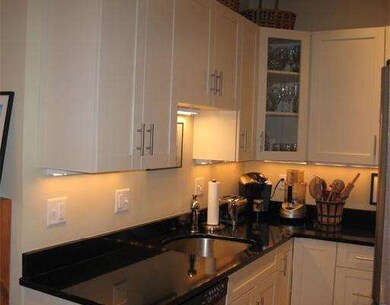
As of August 2018A+ UNIT, GREAT LOCATION! Don't miss this new to market 2BR condo! Updated modern unit with sought after open layout, steps to EBroadway. Unit amenities incl: HW floors thru, in unit laundry hook ups, central AC, ss appliances, granite counters, recessed lighting, 1 Queen BR, 1 Full BR, LR chair rail w/ raised paneling, corner gas FP and warm exposed brick, private deck and private storage. This is a GREAT unit offering it ALL!
Property Details
Home Type
Condominium
Est. Annual Taxes
$6,520
Year Built
1900
Lot Details
0
Listing Details
- Unit Level: 2
- Unit Placement: Middle
- Special Features: None
- Property Sub Type: Condos
- Year Built: 1900
Interior Features
- Has Basement: Yes
- Fireplaces: 1
- Primary Bathroom: No
- Number of Rooms: 4
- Amenities: Public Transportation, Shopping, Park, Walk/Jog Trails, Laundromat, Highway Access, House of Worship, Public School, T-Station, University
- Electric: Circuit Breakers
- Energy: Insulated Windows
- Flooring: Wood
- Bedroom 2: Second Floor
- Bathroom #1: Second Floor
- Kitchen: Second Floor
- Laundry Room: Second Floor
- Master Bedroom: Second Floor
- Master Bedroom Description: Closet, Hard Wood Floor
Exterior Features
- Construction: Frame
- Exterior: Clapboard
- Exterior Unit Features: Deck - Wood
Garage/Parking
- Parking: On Street Permit
- Parking Spaces: 0
Utilities
- Cooling Zones: 1
- Heat Zones: 1
- Hot Water: Natural Gas
Condo/Co-op/Association
- Condominium Name: 489 E. Third Condominium
- Association Fee Includes: Water, Sewer, Master Insurance
- Management: Owner Association
- Pets Allowed: Yes
- No Units: 3
- Unit Building: 2
Ownership History
Date
Name
Owned For
Owner Type
Purchase Details
Listed on
Sep 19, 2018
Closed on
Aug 31, 2018
Sold by
Lynch Tara E
Bought by
Bogdanov Alexander
Seller's Agent
M&K Luxury Sales Team
Coldwell Banker Realty - Boston
Buyer's Agent
M&K Luxury Sales Team
Coldwell Banker Realty - Boston
Sold Price
$2,650
Current Estimated Value
Home Financials for this Owner
Home Financials are based on the most recent Mortgage that was taken out on this home.
Estimated Appreciation
$602,824
Avg. Annual Appreciation
2.06%
Original Mortgage
$315,000
Outstanding Balance
$236,148
Interest Rate
4.5%
Mortgage Type
New Conventional
Estimated Equity
$369,326
Purchase Details
Listed on
Mar 26, 2012
Closed on
Jun 22, 2012
Sold by
Mazza David B
Bought by
Lynch Tara E
Seller's Agent
Lynn Hollenbeck
Seaport Realty Group
Buyer's Agent
Mike Flynn
The Delamere Flynn Group, LLC
List Price
$329,000
Sold Price
$320,000
Premium/Discount to List
-$9,000
-2.74%
Home Financials for this Owner
Home Financials are based on the most recent Mortgage that was taken out on this home.
Avg. Annual Appreciation
8.33%
Original Mortgage
$272,000
Interest Rate
3.84%
Mortgage Type
New Conventional
Purchase Details
Closed on
Jan 14, 2009
Sold by
Kiernan Owen
Bought by
Mazza David B
Home Financials for this Owner
Home Financials are based on the most recent Mortgage that was taken out on this home.
Original Mortgage
$299,250
Interest Rate
5.52%
Mortgage Type
Purchase Money Mortgage
Similar Homes in the area
Create a Home Valuation Report for This Property
The Home Valuation Report is an in-depth analysis detailing your home's value as well as a comparison with similar homes in the area
Home Values in the Area
Average Home Value in this Area
Purchase History
| Date | Type | Sale Price | Title Company |
|---|---|---|---|
| Deed | $525,000 | -- | |
| Deed | $320,000 | -- | |
| Deed | $315,000 | -- |
Source: Public Records
Mortgage History
| Date | Status | Loan Amount | Loan Type |
|---|---|---|---|
| Open | $315,000 | New Conventional | |
| Previous Owner | $272,000 | New Conventional | |
| Previous Owner | $299,250 | Purchase Money Mortgage |
Source: Public Records
Property History
| Date | Event | Price | Change | Sq Ft Price |
|---|---|---|---|---|
| 03/31/2021 03/31/21 | Rented | $2,500 | 0.0% | -- |
| 03/22/2021 03/22/21 | For Rent | $2,500 | -5.7% | -- |
| 09/30/2018 09/30/18 | Rented | $2,650 | +1.9% | -- |
| 09/19/2018 09/19/18 | Price Changed | $2,600 | -3.7% | $4 / Sq Ft |
| 09/19/2018 09/19/18 | For Rent | $2,700 | 0.0% | -- |
| 08/31/2018 08/31/18 | Sold | $525,000 | 0.0% | $868 / Sq Ft |
| 08/15/2018 08/15/18 | Pending | -- | -- | -- |
| 08/13/2018 08/13/18 | For Sale | $525,000 | +64.1% | $868 / Sq Ft |
| 06/22/2012 06/22/12 | Sold | $320,000 | -2.7% | $529 / Sq Ft |
| 04/30/2012 04/30/12 | Pending | -- | -- | -- |
| 03/26/2012 03/26/12 | For Sale | $329,000 | -- | $544 / Sq Ft |
Source: MLS Property Information Network (MLS PIN)
Tax History Compared to Growth
Tax History
| Year | Tax Paid | Tax Assessment Tax Assessment Total Assessment is a certain percentage of the fair market value that is determined by local assessors to be the total taxable value of land and additions on the property. | Land | Improvement |
|---|---|---|---|---|
| 2025 | $6,520 | $563,000 | $0 | $563,000 |
| 2024 | $5,964 | $547,200 | $0 | $547,200 |
| 2023 | $5,758 | $536,100 | $0 | $536,100 |
| 2022 | $5,608 | $515,400 | $0 | $515,400 |
| 2021 | $5,392 | $505,300 | $0 | $505,300 |
| 2020 | $4,898 | $463,800 | $0 | $463,800 |
| 2019 | $4,462 | $423,300 | $0 | $423,300 |
| 2018 | $4,224 | $403,100 | $0 | $403,100 |
| 2017 | $3,990 | $376,800 | $0 | $376,800 |
| 2016 | $3,911 | $355,500 | $0 | $355,500 |
| 2015 | $3,839 | $317,000 | $0 | $317,000 |
| 2014 | $3,559 | $282,900 | $0 | $282,900 |
Source: Public Records
Agents Affiliated with this Home
-
Moira Vittengl
Seller's Agent in 2021
Moira Vittengl
Compass
(978) 248-8081
8 in this area
64 Total Sales
-
M&K Luxury Sales Team
M
Seller's Agent in 2018
M&K Luxury Sales Team
Coldwell Banker Realty - Boston
(617) 733-1238
6 in this area
29 Total Sales
-
Lynn Hollenbeck
Seller's Agent in 2012
Lynn Hollenbeck
Seaport Realty Group
(617) 943-5818
13 in this area
25 Total Sales
-
Mike Flynn
M
Buyer's Agent in 2012
Mike Flynn
The Delamere Flynn Group, LLC
1 Total Sale
Map
Source: MLS Property Information Network (MLS PIN)
MLS Number: 71356819
APN: SBOS-000000-000006-003183-000004
Disclaimer: Certain information contained herein is derived from information provided by parties other than Homes.com. All information provided is deemed reliable, but is not guaranteed to be accurate and should be independently verified.
![]() The property listing data and information, or the Images, set forth herein were provided to MLS Property Information Network, Inc. from third party sources, including sellers, lessors and public records, and were compiled by MLS Property Information Network, Inc. The property listing data and information, and the Images, are for the personal, non-commercial use of consumers having a good faith interest in purchasing or leasing listed properties of the type displayed to them and may not be used for any purpose other than to identify prospective properties which such consumers may have a good faith interest in purchasing or leasing. MLS Property Information Network, Inc. and its subscribers disclaim any and all representations and warranties as to the accuracy of the property listing data and information, or as to the accuracy of any of the Images, set forth herein.
The property listing data and information, or the Images, set forth herein were provided to MLS Property Information Network, Inc. from third party sources, including sellers, lessors and public records, and were compiled by MLS Property Information Network, Inc. The property listing data and information, and the Images, are for the personal, non-commercial use of consumers having a good faith interest in purchasing or leasing listed properties of the type displayed to them and may not be used for any purpose other than to identify prospective properties which such consumers may have a good faith interest in purchasing or leasing. MLS Property Information Network, Inc. and its subscribers disclaim any and all representations and warranties as to the accuracy of the property listing data and information, or as to the accuracy of any of the Images, set forth herein.
Nearby Homes
- 54 I St
- 9-11 Linley Terrace Unit 2
- 597 E 2nd St Unit A
- 597 E 2nd St
- 616 E 4th St Unit 404
- 550 E 3rd St
- 12 I St Unit 1
- 1 Schrepel Place
- 618 E 2nd St Unit 2
- 537 E 2nd St Unit 101
- 565 E Broadway
- 561 E Broadway Unit 561
- 559 E Broadway Unit 559
- 571 E 3rd St
- 428-432 E 3rd St
- 538 E Broadway
- 515 E 2nd St Unit 204
- 515 E 2nd St Unit 206
- 562 E 5th St
- 26 Emerson St