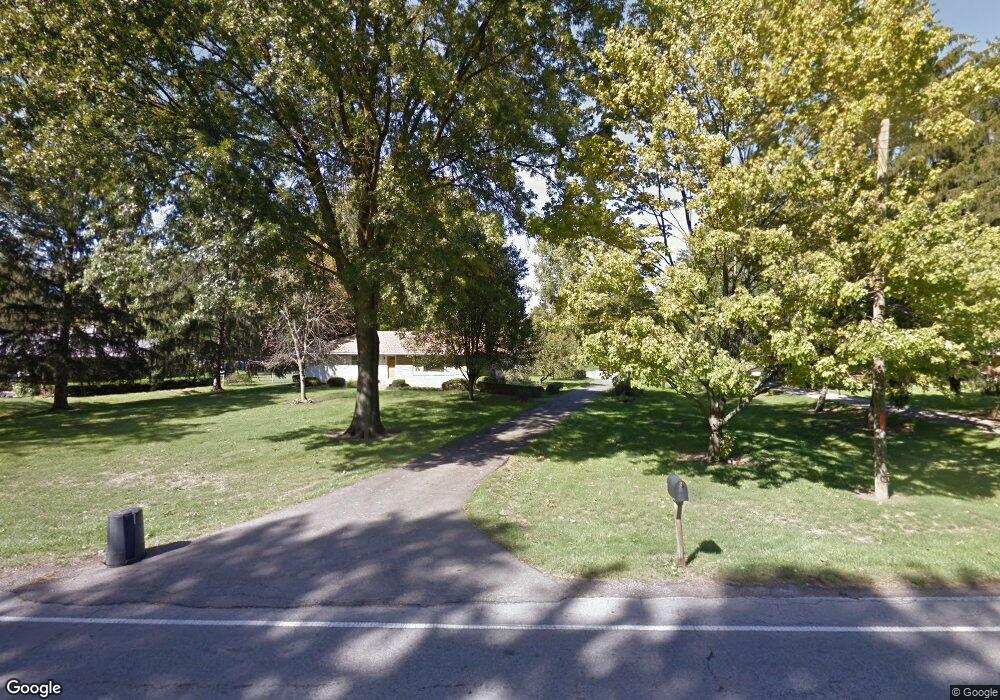
489 E Johnstown Rd Columbus, OH 43230
Estimated Value: $307,278 - $376,000
3
Beds
1
Bath
1,224
Sq Ft
$287/Sq Ft
Est. Value
About This Home
This home is located at 489 E Johnstown Rd, Columbus, OH 43230 and is currently estimated at $351,070, approximately $286 per square foot. 489 E Johnstown Rd is a home located in Franklin County with nearby schools including Jefferson Elementary School, Gahanna East Middle School, and Lincoln High School.
Ownership History
Date
Name
Owned For
Owner Type
Purchase Details
Closed on
Mar 12, 2021
Sold by
Watts Darlene E
Bought by
Pfeil Tamara Edinger
Current Estimated Value
Home Financials for this Owner
Home Financials are based on the most recent Mortgage that was taken out on this home.
Original Mortgage
$165,000
Outstanding Balance
$146,641
Interest Rate
2.73%
Mortgage Type
New Conventional
Estimated Equity
$204,429
Purchase Details
Closed on
Jan 20, 2021
Sold by
Glenn R Miller Living Trust and Hamrick Calvin F
Bought by
Watts Darlene E
Home Financials for this Owner
Home Financials are based on the most recent Mortgage that was taken out on this home.
Original Mortgage
$165,000
Outstanding Balance
$146,641
Interest Rate
2.73%
Mortgage Type
New Conventional
Estimated Equity
$204,429
Purchase Details
Closed on
May 17, 2019
Sold by
Miller Glenn R
Bought by
Glenn R Miller Living Trust
Purchase Details
Closed on
Nov 1, 2010
Sold by
Miller Glenn Roger and Miller Doris Arlene
Bought by
Miller Glenn R and Miller Arlene D
Create a Home Valuation Report for This Property
The Home Valuation Report is an in-depth analysis detailing your home's value as well as a comparison with similar homes in the area
Purchase History
| Date | Buyer | Sale Price | Title Company |
|---|---|---|---|
| Pfeil Tamara Edinger | $265,000 | Gahanna Title | |
| Watts Darlene E | -- | None Listed On Document | |
| Glenn R Miller Living Trust | -- | None Available | |
| Miller Glenn R | -- | None Available | |
| Glenn R Miller Survivor S Trust | -- | None Available | |
| Miller Glenn R | -- | Attorney |
Source: Public Records
Mortgage History
| Date | Status | Borrower | Loan Amount |
|---|---|---|---|
| Open | Pfeil Tamara Edinger | $165,000 |
Source: Public Records
Tax History
| Year | Tax Paid | Tax Assessment Tax Assessment Total Assessment is a certain percentage of the fair market value that is determined by local assessors to be the total taxable value of land and additions on the property. | Land | Improvement |
|---|---|---|---|---|
| 2025 | $4,662 | $75,080 | $31,150 | $43,930 |
| 2024 | $4,662 | $75,080 | $31,150 | $43,930 |
| 2023 | $4,607 | $75,075 | $31,150 | $43,925 |
| 2022 | $4,778 | $60,730 | $22,440 | $38,290 |
| 2021 | $3,754 | $60,730 | $22,440 | $38,290 |
| 2020 | $3,723 | $60,730 | $22,440 | $38,290 |
| 2019 | $3,007 | $50,650 | $18,690 | $31,960 |
| 2018 | $1,493 | $50,650 | $18,690 | $31,960 |
| 2017 | $2,760 | $50,650 | $18,690 | $31,960 |
| 2016 | $2,633 | $45,160 | $17,750 | $27,410 |
| 2015 | $1,318 | $45,160 | $17,750 | $27,410 |
| 2014 | $2,615 | $45,160 | $17,750 | $27,410 |
| 2013 | $1,299 | $45,150 | $17,745 | $27,405 |
Source: Public Records
Map
Nearby Homes
- 440 Colony Place
- 302 Zander Ln Unit 302
- 365 Sycamore Woods Ln Unit 365
- 206 Lintner St
- 108 Walcreek Dr W
- 219 N Hamilton Rd
- 481 Clotts Rd
- 299 Sherwood Meadows Dr
- 875 Pinnacle Pointe Place Unit 32
- 586 Pinegrove Place
- 464 Foxwood Dr
- 667 Salt Lick Ln
- 4220 E Johnstown Rd
- 0 Beecher Crossing
- 169 Flint Ridge Dr
- 370 Beecher Rd
- 309 Baroness Way
- 420 Denwood Ct
- 62 Saint Stephens Ct
- 475 Denwood Ct
- 485 E Johnstown Rd
- 493 E Johnstown Rd
- 0 E Johnstown Rd
- 481 E Johnstown Rd
- 209 Springbrook Place
- 209 Springbrook Dr
- 519 E Johnstown Rd
- 472 Colony Place
- 199 Springbrook Dr
- 484 E Johnstown Rd
- 199 Springbrook Place
- 477 E Johnstown Rd
- 488 E Johnstown Rd
- 229 Springbrook Dr
- 462 Colony Place
- 471 Colony Place
- 189 Springbrook Place
- 189 Springbrook Dr
- 219 Springbrook Dr
- 492 E Johnstown Rd
Your Personal Tour Guide
Ask me questions while you tour the home.