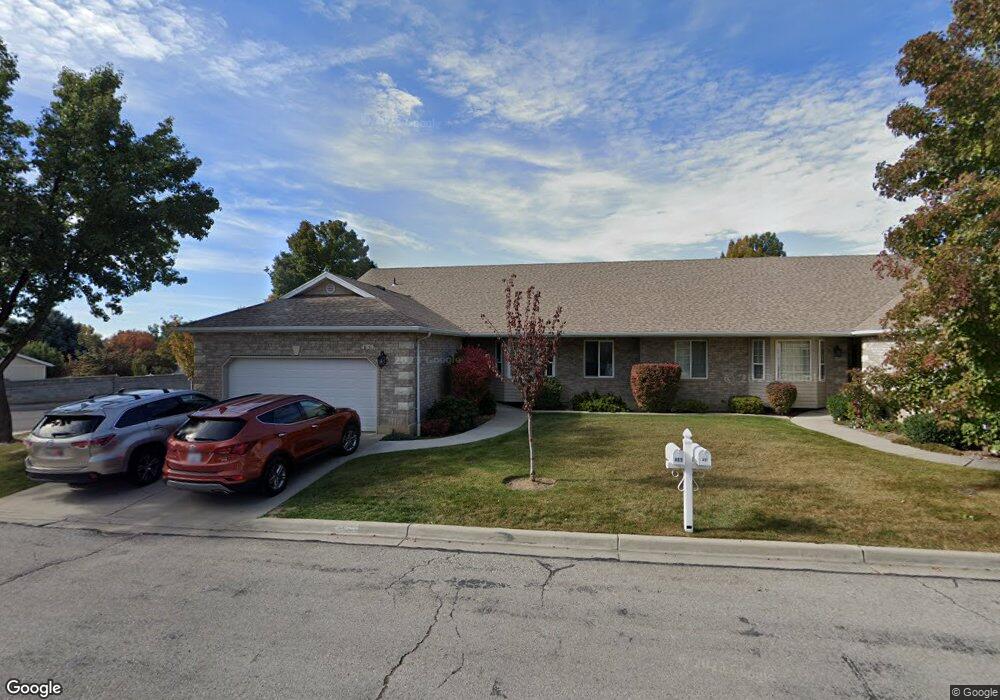
489 N 40 W Lindon, UT 84042
Estimated Value: $545,000 - $592,000
4
Beds
3
Baths
3,430
Sq Ft
$167/Sq Ft
Est. Value
About This Home
This home is located at 489 N 40 W, Lindon, UT 84042 and is currently estimated at $573,675, approximately $167 per square foot. 489 N 40 W is a home located in Utah County with nearby schools including Lindon Elementary School, Oak Canyon Junior High School, and Pleasant Grove High School.
Ownership History
Date
Name
Owned For
Owner Type
Purchase Details
Closed on
Jan 18, 2017
Sold by
Doty Necia L
Bought by
Wendel Roy C and Wendel Cindy P
Current Estimated Value
Purchase Details
Closed on
Feb 23, 1999
Sold by
Doty Necia L
Bought by
Doty Necia L
Home Financials for this Owner
Home Financials are based on the most recent Mortgage that was taken out on this home.
Original Mortgage
$81,000
Interest Rate
6.78%
Purchase Details
Closed on
May 27, 1997
Sold by
Doty Necia L
Bought by
Doty Necia L
Purchase Details
Closed on
May 6, 1997
Sold by
Doty Allen W
Bought by
Doty Necia L
Create a Home Valuation Report for This Property
The Home Valuation Report is an in-depth analysis detailing your home's value as well as a comparison with similar homes in the area
Home Values in the Area
Average Home Value in this Area
Purchase History
| Date | Buyer | Sale Price | Title Company |
|---|---|---|---|
| Wendel Roy C | -- | Old Republic Title | |
| Doty Necia L | -- | First American Title Co | |
| Doty Necia L | -- | Provo Land Title | |
| Doty Necia L | -- | -- |
Source: Public Records
Mortgage History
| Date | Status | Borrower | Loan Amount |
|---|---|---|---|
| Previous Owner | Doty Necia L | $81,000 |
Source: Public Records
Tax History Compared to Growth
Tax History
| Year | Tax Paid | Tax Assessment Tax Assessment Total Assessment is a certain percentage of the fair market value that is determined by local assessors to be the total taxable value of land and additions on the property. | Land | Improvement |
|---|---|---|---|---|
| 2025 | $2,124 | $262,460 | $52,600 | $424,600 |
| 2024 | $2,124 | $261,855 | $0 | $0 |
| 2023 | $2,095 | $277,475 | $0 | $0 |
| 2022 | $1,900 | $242,990 | $0 | $0 |
| 2021 | $1,711 | $330,000 | $39,600 | $290,400 |
| 2020 | $1,738 | $330,000 | $39,600 | $290,400 |
| 2019 | $1,509 | $299,000 | $35,900 | $263,100 |
| 2018 | $1,473 | $275,000 | $33,000 | $242,000 |
| 2017 | $1,291 | $129,250 | $0 | $0 |
| 2016 | $1,271 | $117,700 | $0 | $0 |
| 2015 | $1,344 | $117,700 | $0 | $0 |
| 2014 | $1,198 | $103,950 | $0 | $0 |
Source: Public Records
Map
Nearby Homes