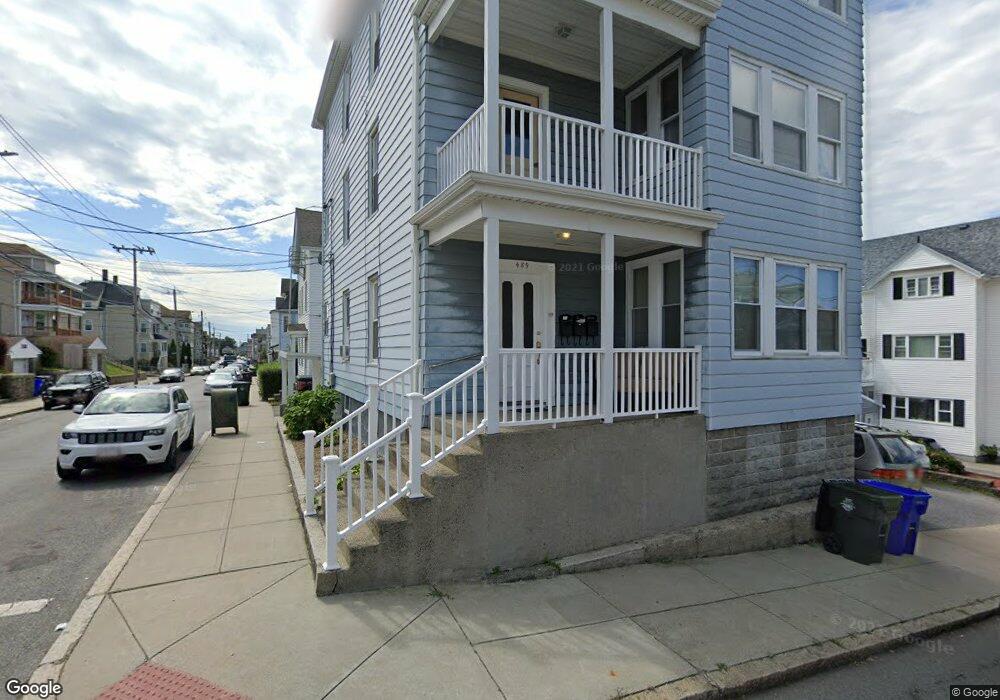
489 Osborn St Fall River, MA 02724
Father Kelly NeighborhoodEstimated Value: $590,018 - $739,000
9
Beds
3
Baths
3,285
Sq Ft
$201/Sq Ft
Est. Value
About This Home
This home is located at 489 Osborn St, Fall River, MA 02724 and is currently estimated at $658,755, approximately $200 per square foot. 489 Osborn St is a home located in Bristol County with nearby schools including Henry Lord Community School, B M C Durfee High School, and Argosy Collegiate Charter School.
Ownership History
Date
Name
Owned For
Owner Type
Purchase Details
Closed on
Apr 16, 2014
Sold by
Desousa Victor
Bought by
Sousa Victor M and Sousa Maria C
Current Estimated Value
Purchase Details
Closed on
Jul 1, 1988
Sold by
Abdallah Alan P
Bought by
Desousa Tiberio T
Home Financials for this Owner
Home Financials are based on the most recent Mortgage that was taken out on this home.
Original Mortgage
$100,000
Interest Rate
10.47%
Mortgage Type
Purchase Money Mortgage
Create a Home Valuation Report for This Property
The Home Valuation Report is an in-depth analysis detailing your home's value as well as a comparison with similar homes in the area
Home Values in the Area
Average Home Value in this Area
Purchase History
| Date | Buyer | Sale Price | Title Company |
|---|---|---|---|
| Sousa Victor M | -- | -- | |
| Desousa Tiberio T | $131,000 | -- |
Source: Public Records
Mortgage History
| Date | Status | Borrower | Loan Amount |
|---|---|---|---|
| Previous Owner | Desousa Tiberio T | $75,000 | |
| Previous Owner | Desousa Tiberio T | $100,000 |
Source: Public Records
Tax History
| Year | Tax Paid | Tax Assessment Tax Assessment Total Assessment is a certain percentage of the fair market value that is determined by local assessors to be the total taxable value of land and additions on the property. | Land | Improvement |
|---|---|---|---|---|
| 2025 | $5,409 | $472,400 | $105,900 | $366,500 |
| 2024 | $5,182 | $451,000 | $102,000 | $349,000 |
| 2023 | $4,563 | $371,900 | $84,300 | $287,600 |
| 2022 | $4,075 | $322,900 | $80,300 | $242,600 |
| 2021 | $3,863 | $279,300 | $76,400 | $202,900 |
| 2020 | $3,494 | $241,800 | $75,300 | $166,500 |
| 2019 | $3,008 | $206,300 | $72,500 | $133,800 |
| 2018 | $2,984 | $204,100 | $78,500 | $125,600 |
| 2017 | $2,806 | $200,400 | $74,800 | $125,600 |
| 2016 | $2,756 | $202,200 | $79,600 | $122,600 |
| 2015 | $2,645 | $202,200 | $79,600 | $122,600 |
| 2014 | $2,656 | $211,100 | $77,300 | $133,800 |
Source: Public Records
Map
Nearby Homes
- 457 Whipple St
- 431 Whipple St
- 467 Whipple St
- 474 Osborn St
- 474 Osborn St Unit 2N
- 463 Osborn St
- 454 Whipple St
- 454 Whipple St Unit 1
- 454 Whipple St Unit 2
- 457 Osborn St
- 457 Osborn St Unit 3
- 457 Osborn St
- 457 Osborn St Unit 1
- 464 Osborn St
- 424 Whipple St
- 411 Whipple St
- 488 Ridge St Unit 3
- 488 Ridge St Unit 2
- 488 Ridge St
- 447-451 Osborn St
Your Personal Tour Guide
Ask me questions while you tour the home.