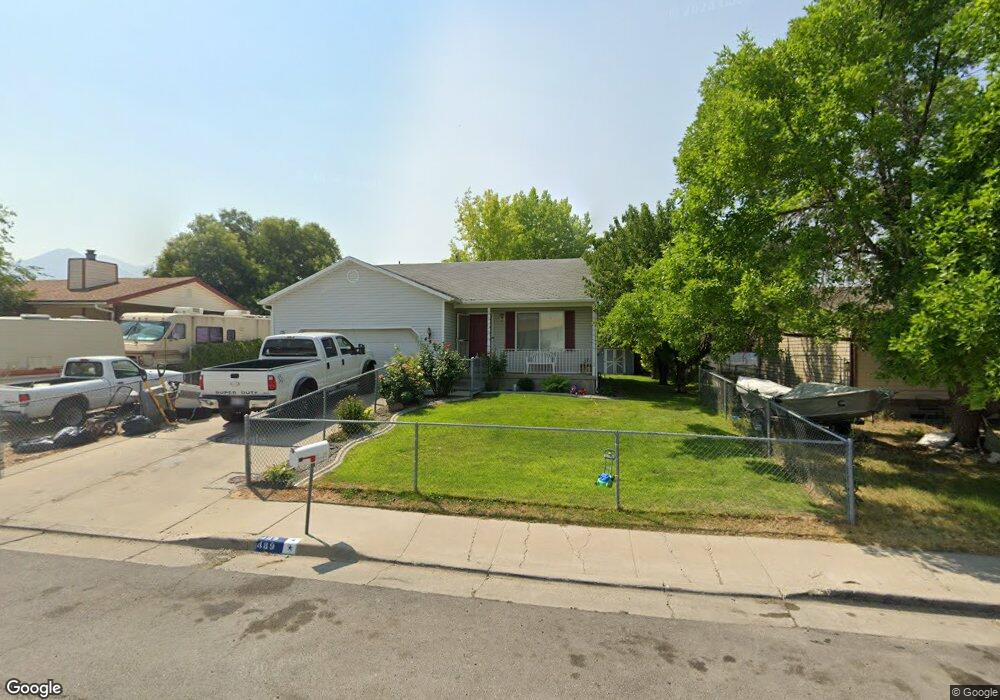
489 Salton St Tooele, UT 84074
Estimated Value: $354,000 - $378,597
3
Beds
2
Baths
1,886
Sq Ft
$196/Sq Ft
Est. Value
About This Home
This home is located at 489 Salton St, Tooele, UT 84074 and is currently estimated at $369,399, approximately $195 per square foot. 489 Salton St is a home located in Tooele County with nearby schools including Northlake Elementary School, Tooele Junior High School, and Tooele High School.
Ownership History
Date
Name
Owned For
Owner Type
Purchase Details
Closed on
Jun 26, 2017
Sold by
Bowers Richard B and Bowers Melody J
Bought by
Rios Ramiro Baez
Current Estimated Value
Home Financials for this Owner
Home Financials are based on the most recent Mortgage that was taken out on this home.
Original Mortgage
$196,377
Outstanding Balance
$167,362
Interest Rate
4.87%
Mortgage Type
FHA
Estimated Equity
$202,037
Purchase Details
Closed on
Jan 11, 2013
Sold by
Bowers Richard B
Bought by
Bowers Richard B and Bowers Melody J
Create a Home Valuation Report for This Property
The Home Valuation Report is an in-depth analysis detailing your home's value as well as a comparison with similar homes in the area
Home Values in the Area
Average Home Value in this Area
Purchase History
| Date | Buyer | Sale Price | Title Company |
|---|---|---|---|
| Rios Ramiro Baez | -- | Old Republic Title | |
| Bowers Richard B | -- | None Available |
Source: Public Records
Mortgage History
| Date | Status | Borrower | Loan Amount |
|---|---|---|---|
| Open | Rios Ramiro Baez | $196,377 |
Source: Public Records
Tax History Compared to Growth
Tax History
| Year | Tax Paid | Tax Assessment Tax Assessment Total Assessment is a certain percentage of the fair market value that is determined by local assessors to be the total taxable value of land and additions on the property. | Land | Improvement |
|---|---|---|---|---|
| 2025 | $2,271 | $189,385 | $55,000 | $134,385 |
| 2024 | $2,413 | $184,218 | $55,000 | $129,218 |
| 2023 | $2,413 | $195,380 | $52,383 | $142,997 |
| 2022 | $2,278 | $196,001 | $66,110 | $129,891 |
| 2021 | $1,689 | $121,568 | $20,763 | $100,805 |
| 2020 | $1,613 | $201,394 | $37,750 | $163,644 |
| 2019 | $1,519 | $186,517 | $37,750 | $148,767 |
| 2018 | $1,256 | $146,224 | $30,000 | $116,224 |
| 2017 | $1,058 | $146,224 | $30,000 | $116,224 |
| 2016 | $771 | $62,889 | $15,125 | $47,764 |
| 2015 | $771 | $56,097 | $0 | $0 |
| 2014 | -- | $56,097 | $0 | $0 |
Source: Public Records
Map
Nearby Homes
- 413 N 300 W
- 225 230 N
- 541 N Coleman St
- 307 N 200 W
- 225 N 200 W
- 453 W Vine St
- 165 N 200 W
- 372 W 600 N Unit 42
- 362 W 600 N Unit 43
- 352 W 600 N Unit 44
- 605 N 640 W
- 614 N 640 W
- Snowbird Plan at Vista Meadows
- Sundance Plan at Vista Meadows
- Brighton Plan at Vista Meadows
- Solitude Plan at Vista Meadows
- 180 W Utah Ave
- 152 N 200 W
- 377 W 630 St N Unit 22
- 745 W Mckellar St