C
Landlord's Agent in 2025
Charles Grant
Virtual Properties Realty.com
(404) 419-3500
Estimated Value: $490,000 - $527,000
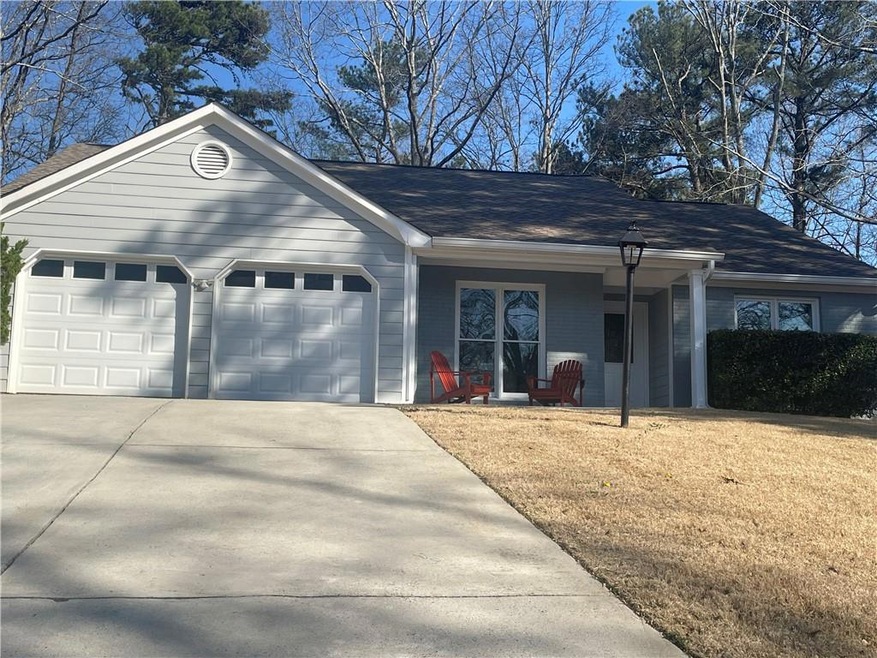
Welcome to 4890 Hampton Square Drive, a beautifully renovated 3-bedroom home that radiates warmth and charm. The open, airy floor plan is filled with natural light, creating a welcoming space that’s perfect for everyday living. High ceilings and gleaming wood floors enhance the home’s stylish appeal, while brand-new appliances offer modern convenience.
Cozy up during the winter months by the inviting fireplace in the living room, the perfect spot to unwind after a long day or entertain friends and family. The private, fenced-in backyard provides a peaceful retreat for outdoor enjoyment year-round.
Nestled in a desirable neighborhood, this home offers access to top-rated schools like Chattahoochee High School, Taylor Middle School, and Ocee Elementary—ideal for families. Publix is just a short drive away, and Avalon, a renowned shopping, dining, and entertainment hub, is minutes from your doorstep.
With easy access to major highways 400 and 141, you’re perfectly positioned to enjoy a quick commute to work, hospitals, parks, and everything North Fulton has to offer. This home blends the tranquility of suburban living with the convenience of being close to all the essential amenities. Don’t miss out on this stunning property—schedule your tour today!
Last Agent to Rent the Property
Virtual Properties Realty.com License #439896 Listed on: 03/09/2025

Last Renter's Agent
Virtual Properties Realty.com License #439896 Listed on: 03/09/2025
| Date | Buyer | Sale Price | Title Company |
|---|---|---|---|
| Vergara Anamaria | $385,000 | -- | |
| Harandi Lyda | $128,000 | -- |
| Date | Status | Borrower | Loan Amount |
|---|---|---|---|
| Previous Owner | Harandi Lyda | $98,000 |
| Date | Event | Price | List to Sale | Price per Sq Ft | Prior Sale |
|---|---|---|---|---|---|
| 04/04/2025 04/04/25 | Rented | $2,700 | 0.0% | -- | |
| 03/29/2025 03/29/25 | Under Contract | -- | -- | -- | |
| 03/09/2025 03/09/25 | For Rent | $2,700 | +3.8% | -- | |
| 03/10/2024 03/10/24 | Rented | $2,600 | -3.7% | -- | |
| 02/16/2024 02/16/24 | Under Contract | -- | -- | -- | |
| 02/05/2024 02/05/24 | For Rent | $2,700 | +8.0% | -- | |
| 02/08/2022 02/08/22 | Under Contract | -- | -- | -- | |
| 02/07/2022 02/07/22 | Rented | $2,500 | 0.0% | -- | |
| 02/01/2022 02/01/22 | For Rent | $2,500 | 0.0% | -- | |
| 10/29/2021 10/29/21 | Sold | $385,000 | 0.0% | $238 / Sq Ft | View Prior Sale |
| 09/30/2021 09/30/21 | Pending | -- | -- | -- | |
| 09/03/2021 09/03/21 | For Sale | $385,000 | 0.0% | $238 / Sq Ft | |
| 08/31/2021 08/31/21 | Pending | -- | -- | -- | |
| 08/04/2021 08/04/21 | For Sale | $385,000 | 0.0% | $238 / Sq Ft | |
| 08/17/2018 08/17/18 | Rented | $1,500 | 0.0% | -- | |
| 08/08/2018 08/08/18 | Price Changed | $1,500 | -3.2% | $1 / Sq Ft | |
| 08/05/2018 08/05/18 | Price Changed | $1,550 | -3.1% | $1 / Sq Ft | |
| 07/24/2018 07/24/18 | For Rent | $1,600 | +33.3% | -- | |
| 04/11/2012 04/11/12 | Rented | $1,200 | -4.0% | -- | |
| 03/12/2012 03/12/12 | Under Contract | -- | -- | -- | |
| 03/08/2012 03/08/12 | For Rent | $1,250 | -- | -- |
| Year | Tax Paid | Tax Assessment Tax Assessment Total Assessment is a certain percentage of the fair market value that is determined by local assessors to be the total taxable value of land and additions on the property. | Land | Improvement |
|---|---|---|---|---|
| 2025 | $4,951 | $216,000 | $50,200 | $165,800 |
| 2023 | $4,951 | $159,840 | $44,640 | $115,200 |
| 2022 | $4,165 | $135,720 | $27,120 | $108,600 |
| 2021 | $3,403 | $108,000 | $26,800 | $81,200 |
| 2020 | $3,299 | $102,480 | $23,560 | $78,920 |
| 2019 | $397 | $100,640 | $23,120 | $77,520 |
| 2018 | $2,921 | $89,680 | $21,080 | $68,600 |
| 2017 | $2,354 | $69,160 | $14,400 | $54,760 |
| 2016 | $2,320 | $69,160 | $14,400 | $54,760 |
| 2015 | $2,346 | $69,160 | $14,400 | $54,760 |
| 2014 | $2,343 | $66,440 | $14,280 | $52,160 |
C
Landlord's Agent in 2025
Charles Grant
Virtual Properties Realty.com
(404) 419-3500
M
Seller's Agent in 2024
Marie Andree Roy
NOT A VALID MEMBER
K
Buyer's Agent in 2024
Katie Hendon
Harry Norman Realties
(404) 539-1282
48 Total Sales
Seller's Agent in 2021
Celine Higgins Evans
Simply List
(470) 309-1545
484 Total Sales
Seller's Agent in 2018
Yanni Mobasherian
Chapman Hall Realtors
(678) 698-8058
134 Total Sales
Buyer's Agent in 2018
Sonya Edwards
Virtual Properties Realty.com
(404) 274-5810
36 Total Sales
Source: First Multiple Listing Service (FMLS)
MLS Number: 7526480
APN: 11-0451-0164-003-7
Disclaimer: Certain information contained herein is derived from information provided by parties other than Homes.com. All information provided is deemed reliable, but is not guaranteed to be accurate and should be independently verified.
![]() Listings identified with the FMLS IDX logo come from FMLS and are held by brokerage firms other than the owner of this website. The listing brokerage is identified in any listing details. Information is deemed reliable but is not guaranteed. If you believe any FMLS listing contains material that infringes your copyrighted work please visit www.fmls.com/dmca to review our DMCA policy and learn how to submit a takedown request. © 2025 First Multiple Listing Service, Inc.
Listings identified with the FMLS IDX logo come from FMLS and are held by brokerage firms other than the owner of this website. The listing brokerage is identified in any listing details. Information is deemed reliable but is not guaranteed. If you believe any FMLS listing contains material that infringes your copyrighted work please visit www.fmls.com/dmca to review our DMCA policy and learn how to submit a takedown request. © 2025 First Multiple Listing Service, Inc.