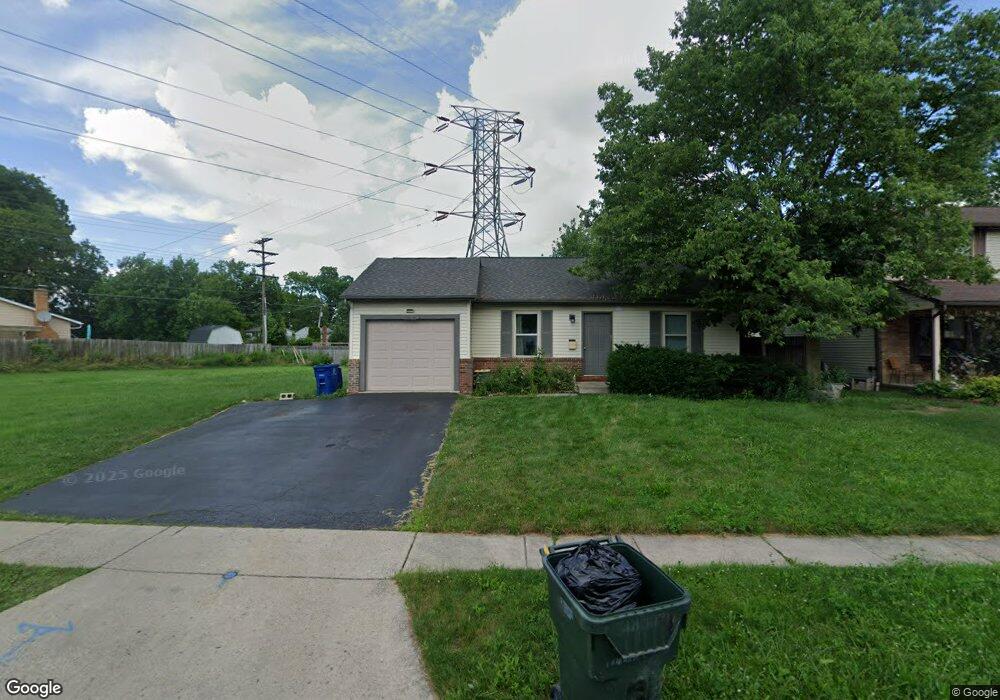
4890 Tamarack Blvd Columbus, OH 43229
Forest Park East NeighborhoodEstimated Value: $175,000 - $296,000
3
Beds
1
Bath
991
Sq Ft
$245/Sq Ft
Est. Value
About This Home
This home is located at 4890 Tamarack Blvd, Columbus, OH 43229 and is currently estimated at $242,875, approximately $245 per square foot. 4890 Tamarack Blvd is a home located in Franklin County with nearby schools including Northtowne Elementary School, Woodward Park Middle School, and Northland High School.
Ownership History
Date
Name
Owned For
Owner Type
Purchase Details
Closed on
Jun 29, 2005
Sold by
Smith Donald F and Smith Deborah E
Bought by
Smith Emilie M
Current Estimated Value
Home Financials for this Owner
Home Financials are based on the most recent Mortgage that was taken out on this home.
Original Mortgage
$75,000
Interest Rate
5.68%
Mortgage Type
Purchase Money Mortgage
Purchase Details
Closed on
May 20, 2004
Sold by
Chase Manhattan Mortgage Corp
Bought by
Smith Emilie M and Smith Donald F
Purchase Details
Closed on
Jan 9, 2004
Sold by
Federal Home Loan Mortgage Corporation
Bought by
Chase Manhattan Mortgage Corp
Purchase Details
Closed on
Oct 28, 2003
Sold by
Villareal Edward and Chase Manhattan Mortgage Corp
Bought by
Federal Home Loan Mortgage Corporation
Purchase Details
Closed on
Aug 8, 1990
Create a Home Valuation Report for This Property
The Home Valuation Report is an in-depth analysis detailing your home's value as well as a comparison with similar homes in the area
Home Values in the Area
Average Home Value in this Area
Purchase History
| Date | Buyer | Sale Price | Title Company |
|---|---|---|---|
| Smith Emilie M | -- | Tri Star T | |
| Smith Emilie M | $76,000 | -- | |
| Chase Manhattan Mortgage Corp | $76,000 | Resource Title Agency Inc | |
| Federal Home Loan Mortgage Corporation | $54,000 | -- | |
| -- | $66,500 | -- |
Source: Public Records
Mortgage History
| Date | Status | Borrower | Loan Amount |
|---|---|---|---|
| Closed | Smith Emilie M | $75,000 |
Source: Public Records
Tax History Compared to Growth
Tax History
| Year | Tax Paid | Tax Assessment Tax Assessment Total Assessment is a certain percentage of the fair market value that is determined by local assessors to be the total taxable value of land and additions on the property. | Land | Improvement |
|---|---|---|---|---|
| 2024 | $3,811 | $83,160 | $42,630 | $40,530 |
| 2023 | $3,763 | $83,160 | $42,630 | $40,530 |
| 2022 | $1,708 | $32,140 | $9,910 | $22,230 |
| 2021 | $1,711 | $32,140 | $9,910 | $22,230 |
| 2020 | $1,714 | $32,140 | $9,910 | $22,230 |
| 2019 | $1,624 | $26,110 | $7,910 | $18,200 |
| 2018 | $1,514 | $26,110 | $7,910 | $18,200 |
| 2017 | $1,623 | $26,110 | $7,910 | $18,200 |
| 2016 | $1,546 | $22,750 | $14,770 | $7,980 |
| 2015 | $1,407 | $22,750 | $14,770 | $7,980 |
| 2014 | $1,411 | $22,750 | $14,770 | $7,980 |
| 2013 | $1,034 | $33,810 | $15,540 | $18,270 |
Source: Public Records
Map
Nearby Homes
- 5022 Sienna Ln
- 1704 Riverbirch Dr
- 4923 Karl Rd Unit 4925
- 2033 Brittany Rd
- 4714 Ascot Dr
- 5124 Northcliff Loop W
- 4852 Colonel Perry Dr
- 1485 Norma Rd
- 4849 Heatherton Dr
- 2134 Trent Rd
- 4816 Bourke Rd
- 4761 Colonel Perry Dr
- 4800 Bourke Rd
- 4885 Northtowne Blvd
- 4815 Bourke Rd
- 5231 Arrowood Ct
- 2058 Northcliff Dr
- 2158 Kilbourne Ave
- 2166 Waldorf Rd
- 1414 Alvina Dr
- 4904 Tamarack Blvd
- 4874 Tamarack Blvd
- 1816 Coghill Dr
- 1810 Coghill Dr
- 1770 Nestling Dr
- 4912 Tamarack Blvd
- 1800 Coghill Dr
- 1822 Coghill Dr
- 1761 Norma Rd
- 4857 Tamarack Blvd
- 4920 Tamarack Blvd
- 1760 Nestling Dr
- 4909 Lyle Rd
- 4901 Lyle Rd
- 1753 Norma Rd
- 1765 Nestling Dr
- 4928 Tamarack Blvd
- 1752 Nestling Dr
- 4845 Tamarack Blvd
- 1821 Coghill Dr