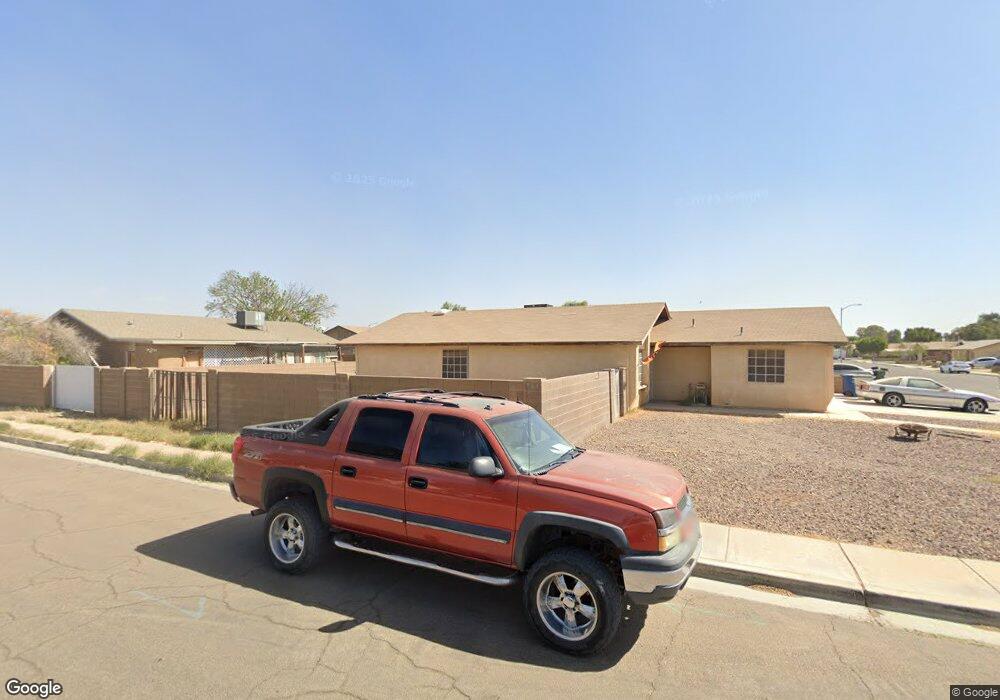
4892 W 21st Ln Yuma, AZ 85364
Sierra Sunset NeighborhoodEstimated Value: $245,000 - $254,000
3
Beds
2
Baths
1,120
Sq Ft
$223/Sq Ft
Est. Value
About This Home
This home is located at 4892 W 21st Ln, Yuma, AZ 85364 and is currently estimated at $250,281, approximately $223 per square foot. 4892 W 21st Ln is a home located in Yuma County with nearby schools including Valley Horizon Elementary School, Crane Middle School, and Cibola High School.
Ownership History
Date
Name
Owned For
Owner Type
Purchase Details
Closed on
Mar 18, 2009
Sold by
Us Bank National Association
Bought by
Jerpseth Connie Lynn and Jerpseth Lea
Current Estimated Value
Home Financials for this Owner
Home Financials are based on the most recent Mortgage that was taken out on this home.
Original Mortgage
$86,900
Interest Rate
5.19%
Mortgage Type
Purchase Money Mortgage
Purchase Details
Closed on
Dec 30, 2008
Sold by
Villalobos Ruben and Villalobos Kim
Bought by
Us Bank National Association and Sabr 2006-Nc2
Purchase Details
Closed on
Apr 30, 1998
Sold by
Halls Development Group Llc
Bought by
Villalobos Ruben and Villalobos Kim
Home Financials for this Owner
Home Financials are based on the most recent Mortgage that was taken out on this home.
Original Mortgage
$74,100
Interest Rate
7.13%
Mortgage Type
New Conventional
Create a Home Valuation Report for This Property
The Home Valuation Report is an in-depth analysis detailing your home's value as well as a comparison with similar homes in the area
Home Values in the Area
Average Home Value in this Area
Purchase History
| Date | Buyer | Sale Price | Title Company |
|---|---|---|---|
| Jerpseth Connie Lynn | $112,000 | First American | |
| Us Bank National Association | $108,000 | First American | |
| Villalobos Ruben | $78,000 | Yuma Title | |
| Halls Development Group Llc | -- | Yuma Title |
Source: Public Records
Mortgage History
| Date | Status | Borrower | Loan Amount |
|---|---|---|---|
| Previous Owner | Jerpseth Connie Lynn | $86,900 | |
| Previous Owner | Villalobos Ruben | $74,100 |
Source: Public Records
Tax History Compared to Growth
Tax History
| Year | Tax Paid | Tax Assessment Tax Assessment Total Assessment is a certain percentage of the fair market value that is determined by local assessors to be the total taxable value of land and additions on the property. | Land | Improvement |
|---|---|---|---|---|
| 2025 | $1,351 | $12,676 | $2,979 | $9,697 |
| 2024 | $1,286 | $12,072 | $2,955 | $9,117 |
| 2023 | $1,286 | $11,498 | $2,744 | $8,754 |
| 2022 | $1,253 | $10,950 | $2,942 | $8,008 |
| 2021 | $1,320 | $10,428 | $2,893 | $7,535 |
| 2020 | $1,282 | $9,933 | $2,838 | $7,095 |
| 2019 | $1,260 | $9,460 | $3,013 | $6,447 |
| 2018 | $1,166 | $9,009 | $3,397 | $5,612 |
| 2017 | $1,142 | $9,009 | $3,397 | $5,612 |
| 2016 | $1,097 | $8,171 | $2,484 | $5,687 |
| 2015 | $903 | $7,782 | $2,431 | $5,351 |
| 2014 | $903 | $7,411 | $2,386 | $5,025 |
Source: Public Records
Map
Nearby Homes
- 2158 S 46th Dr
- 2237 S 46th Way
- 0060 S 48th Ave
- 1765 S 48th Ave
- 1718 S 47th Dr
- 1629 S 48th Ave
- 4334 W 24th Place
- 4701 W County 9th St
- 4549 W 16th Ln
- 4429 W 25 Dr
- 2628 S 44th Trail
- 4268 W 24th Rd
- 2271 S 42nd Ave
- 2589 S 43rd Trail
- 4332 W 17th Place
- 4708 W 28th Place
- 1570 S 46th Ave
- 4427 W 16th Place
- 8765 S Avenue D
- 2872 S 48th Dr
- 4880 W 21st Ln
- 4891 W 21st Place
- 4879 W 21st Place
- 4868 W 21st Ln
- 2174 S 48th Way
- 4881 W 21st Ln
- 2162 S 48th Way
- 4867 W 21st Place
- 2186 S 48th Way
- 4893 W 21st Ln
- 4877 W 21st Ln
- 2158 S 48th Way
- 4899 W 21st Ln
- 4856 W 21st Ln
- 4869 W 21st Ln
- 4855 W 21st Place
- 4890 W 21st Place
- 2146 S 48th Way
- 4878 W 21st Place
- 4844 W 21st Ln