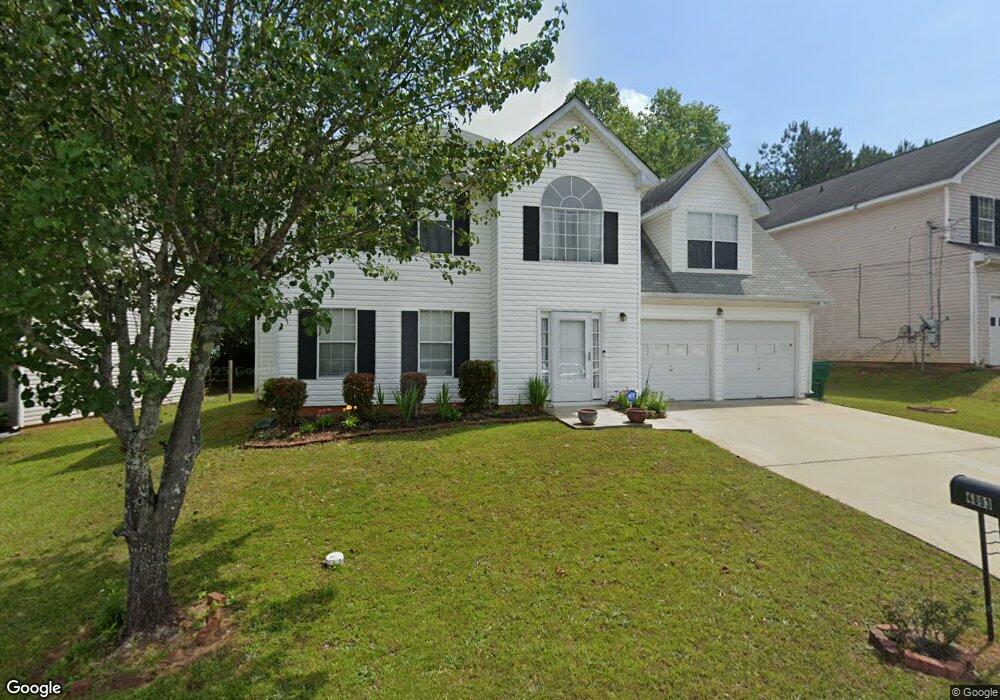
4893 Creekside Place Unit 11B Decatur, GA 30035
Southwest DeKalb NeighborhoodEstimated Value: $255,000 - $311,000
4
Beds
3
Baths
1,930
Sq Ft
$141/Sq Ft
Est. Value
About This Home
This home is located at 4893 Creekside Place Unit 11B, Decatur, GA 30035 and is currently estimated at $273,046, approximately $141 per square foot. 4893 Creekside Place Unit 11B is a home located in DeKalb County with nearby schools including Flat Rock Elementary School, Miller Grove Middle School, and Miller Grove High School.
Ownership History
Date
Name
Owned For
Owner Type
Purchase Details
Closed on
Mar 17, 2022
Sold by
Linton Jennifer L
Bought by
Linton Othniel M and Linton Jennifer L
Current Estimated Value
Home Financials for this Owner
Home Financials are based on the most recent Mortgage that was taken out on this home.
Original Mortgage
$167,067
Outstanding Balance
$145,885
Interest Rate
3.92%
Mortgage Type
New Conventional
Estimated Equity
$127,161
Purchase Details
Closed on
Jan 5, 2006
Sold by
Wells Fargo Bk Na 2002-Bc1
Bought by
Linton Jennifer
Home Financials for this Owner
Home Financials are based on the most recent Mortgage that was taken out on this home.
Original Mortgage
$113,600
Interest Rate
6.21%
Mortgage Type
New Conventional
Purchase Details
Closed on
Sep 6, 2005
Sold by
Billings Jeff D
Bought by
Wells Fargo Bank Minnesota
Purchase Details
Closed on
Feb 12, 2002
Sold by
Perry Xavier
Bought by
Billings Jeff D
Home Financials for this Owner
Home Financials are based on the most recent Mortgage that was taken out on this home.
Original Mortgage
$151,050
Interest Rate
7.18%
Mortgage Type
New Conventional
Create a Home Valuation Report for This Property
The Home Valuation Report is an in-depth analysis detailing your home's value as well as a comparison with similar homes in the area
Home Values in the Area
Average Home Value in this Area
Purchase History
| Date | Buyer | Sale Price | Title Company |
|---|---|---|---|
| Linton Othniel M | -- | -- | |
| Linton Jennifer | $142,000 | -- | |
| Wells Fargo Bank Minnesota | $112,374 | -- | |
| Billings Jeff D | $160,000 | -- |
Source: Public Records
Mortgage History
| Date | Status | Borrower | Loan Amount |
|---|---|---|---|
| Open | Linton Othniel M | $167,067 | |
| Previous Owner | Linton Jennifer | $113,600 | |
| Previous Owner | Billings Jeff D | $151,050 |
Source: Public Records
Tax History Compared to Growth
Tax History
| Year | Tax Paid | Tax Assessment Tax Assessment Total Assessment is a certain percentage of the fair market value that is determined by local assessors to be the total taxable value of land and additions on the property. | Land | Improvement |
|---|---|---|---|---|
| 2025 | $3,535 | $107,680 | $16,000 | $91,680 |
| 2024 | $3,803 | $110,920 | $16,000 | $94,920 |
| 2023 | $3,803 | $101,280 | $12,000 | $89,280 |
| 2022 | $3,276 | $96,640 | $8,000 | $88,640 |
| 2021 | $2,468 | $73,160 | $8,000 | $65,160 |
| 2020 | $1,949 | $57,960 | $8,000 | $49,960 |
| 2019 | $1,790 | $53,880 | $8,000 | $45,880 |
| 2018 | $1,473 | $48,760 | $8,000 | $40,760 |
| 2017 | $1,229 | $36,320 | $5,160 | $31,160 |
| 2016 | $1,526 | $45,760 | $5,160 | $40,600 |
| 2014 | $669 | $20,720 | $5,160 | $15,560 |
Source: Public Records
Map
Nearby Homes
- 4817 Hidden Creek Place Unit 2B
- 2180 Hidden Creek Dr
- 2109 Creekview Trail
- 4783 Creekside Place
- 2317 Wilkins Ct
- 5655 Covington Hwy
- 2322 Wilkins Ct
- 2329 Wilkins Cove
- 2332 Wilkins Ct Unit 1
- 2267 Hampton Dr Unit 1
- 4839 Plymouth Trace Unit 2
- 4890 Wilkins Station Dr
- 2078 Moss Hill Rd
- 2080 Moss Hill Rd
- 2082 Moss Hill Rd
- 2084 Moss Hill Rd
- 2086 Moss Hill Rd
- 2088 Moss Hill Rd
- 5042 Chadwick Ct
- 2098 Moss Hill Rd
- 4887 Creekside Place
- 4901 Creekside Place
- 2215 Creekview Trail
- 4907 Creekside Place
- 4883 Creekside Place
- 2221 Creekview Trail Unit 2A
- 2211 Creekview Trail Unit 11A
- 4898 Creekside Place Unit 11B
- 4892 Creekside Place
- 2227 Creekview Trail Unit 2
- 4886 Creekside Place
- 2205 Creekview Trail
- 4913 Creekside Place Unit 11B
- 4879 Creekside Place Unit 2B
- 4908 Creekside Place Unit 11B
- 4882 Creekside Place
- 2222 Creekview Glen
- 2239 Creekview Trail
- 2199 Creekview Trail
- 2212 Creekview Trail