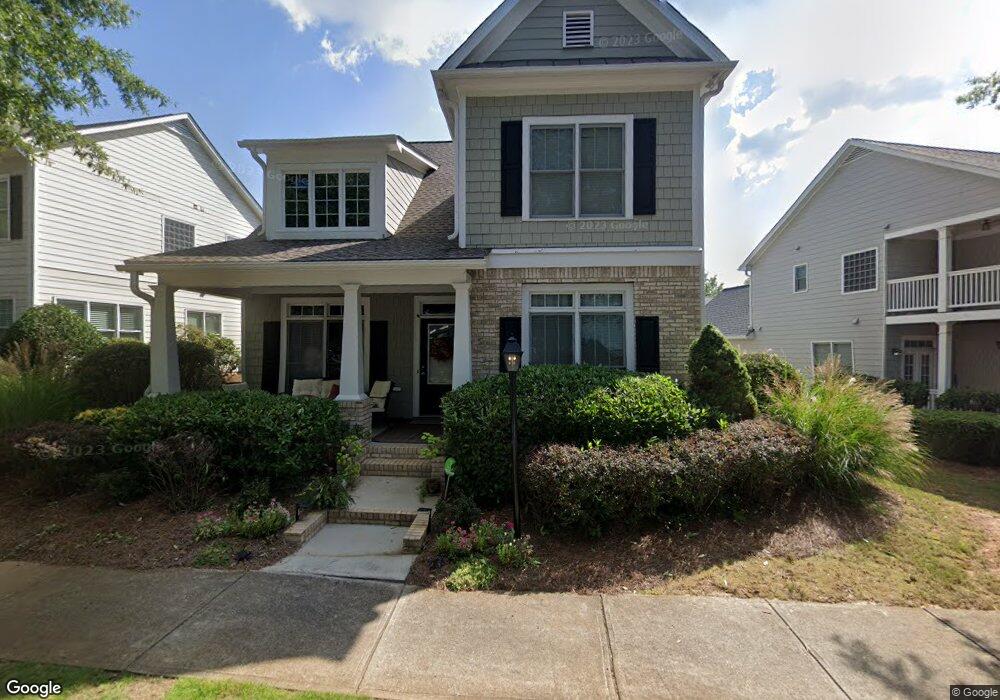
4895 Backbay St Unit 22 Suwanee, GA 30024
Estimated Value: $524,369 - $564,000
4
Beds
3
Baths
2,226
Sq Ft
$246/Sq Ft
Est. Value
About This Home
This home is located at 4895 Backbay St Unit 22, Suwanee, GA 30024 and is currently estimated at $547,342, approximately $245 per square foot. 4895 Backbay St Unit 22 is a home located in Gwinnett County with nearby schools including Level Creek Elementary School, North Gwinnett Middle School, and North Gwinnett High School.
Ownership History
Date
Name
Owned For
Owner Type
Purchase Details
Closed on
Nov 21, 2019
Sold by
Cummings Boston A
Bought by
Havrilak Cynthia and Havrilak Thomas
Current Estimated Value
Home Financials for this Owner
Home Financials are based on the most recent Mortgage that was taken out on this home.
Original Mortgage
$299,700
Outstanding Balance
$261,994
Interest Rate
3.75%
Mortgage Type
New Conventional
Estimated Equity
$285,348
Purchase Details
Closed on
Feb 5, 2015
Sold by
Wright Scott Harvey
Bought by
Cummings Boston A and Ma Xiaoxiao
Purchase Details
Closed on
Mar 26, 2007
Sold by
Richport Properties Inc
Bought by
Wright Scott H
Home Financials for this Owner
Home Financials are based on the most recent Mortgage that was taken out on this home.
Original Mortgage
$50,780
Interest Rate
6.01%
Mortgage Type
New Conventional
Create a Home Valuation Report for This Property
The Home Valuation Report is an in-depth analysis detailing your home's value as well as a comparison with similar homes in the area
Home Values in the Area
Average Home Value in this Area
Purchase History
| Date | Buyer | Sale Price | Title Company |
|---|---|---|---|
| Havrilak Cynthia | $333,000 | -- | |
| Cummings Boston A | $270,000 | -- | |
| Wright Scott H | $253,900 | -- |
Source: Public Records
Mortgage History
| Date | Status | Borrower | Loan Amount |
|---|---|---|---|
| Open | Havrilak Cynthia | $299,700 | |
| Previous Owner | Wright Scott H | $50,780 | |
| Previous Owner | Wright Scott H | $203,120 |
Source: Public Records
Tax History
| Year | Tax Paid | Tax Assessment Tax Assessment Total Assessment is a certain percentage of the fair market value that is determined by local assessors to be the total taxable value of land and additions on the property. | Land | Improvement |
|---|---|---|---|---|
| 2025 | $1,297 | $221,400 | $44,080 | $177,320 |
| 2024 | $1,297 | $213,080 | $38,400 | $174,680 |
| 2023 | $1,297 | $193,680 | $38,400 | $155,280 |
| 2022 | $2,208 | $176,760 | $35,200 | $141,560 |
| 2021 | $1,920 | $136,240 | $26,600 | $109,640 |
| 2020 | $1,905 | $133,200 | $26,600 | $106,600 |
| 2019 | $3,601 | $123,040 | $36,000 | $87,040 |
| 2018 | $3,619 | $123,040 | $36,000 | $87,040 |
| 2016 | $3,293 | $108,000 | $32,000 | $76,000 |
| 2015 | $3,344 | $99,760 | $21,200 | $78,560 |
| 2014 | $3,120 | $92,480 | $21,200 | $71,280 |
Source: Public Records
Map
Nearby Homes
- 793 Village Field Ct
- 792 Village Field Ct
- 4434 Lassen Ct
- 4422 Grove Field Park
- 4629 Arbor Crest Place Unit 3
- 4529 Silver Peak Pkwy Unit 2
- 4358 Grove Field Ct
- 4405 Red Rock Point
- 4460 Suwanee Dam Rd
- 4366 Baverton Dr
- 755 Amberton Close Unit 2
- 1309 Bennett Creek Overlook
- 1378 Bennett Creek Overlook
- 863 Red Rock Ct Unit 4
- 4321 Baverton Dr
- 858 Red Rock Ct
- 4271 Baverton Dr
- 4465 Settles Bridge Rd
- 754 Urban Grange Way
- 557 Cypher Dr
- 4895 Backbay St
- 4885 Backbay St Unit 4
- 4905 Backbay St
- 4905 Backbay St Unit 4905
- 4905 Backbay St
- 4875 Backbay St
- 851 Cotton Mill Place Unit 4
- 4894 Backbay St
- 861 Cotton Mill Place
- 749 Village Crest Dr
- 739 Village Crest Dr
- 739 Village Crest Dr Unit 4 Ph 2
- 759 Village Crest Dr
- 759 Village Crest Dr Unit 1
- 4865 Backbay St
- 4865 Backbay St Unit 4
- 729 Village Crest Dr Unit 4
- 871 Cotton Mill Place
- 4884 Backbay St
- 675 Grove Manor Ct
Your Personal Tour Guide
Ask me questions while you tour the home.