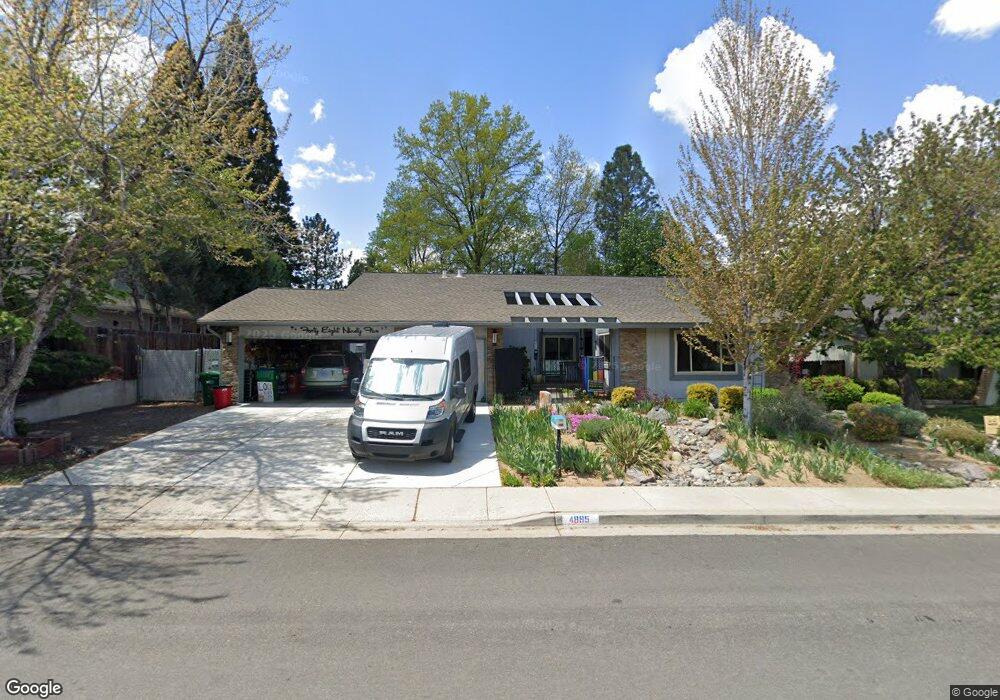
4895 Cool Springs Dr Reno, NV 89509
Skyline Boulevard NeighborhoodEstimated Value: $632,000 - $688,000
3
Beds
2
Baths
1,809
Sq Ft
$369/Sq Ft
Est. Value
About This Home
This home is located at 4895 Cool Springs Dr, Reno, NV 89509 and is currently estimated at $667,508, approximately $368 per square foot. 4895 Cool Springs Dr is a home located in Washoe County with nearby schools including Huffaker Elementary School, Edward L Pine Middle School, and Reno High School.
Ownership History
Date
Name
Owned For
Owner Type
Purchase Details
Closed on
Feb 2, 2016
Sold by
Walker Debra S
Bought by
Walker Engstrom 2009 Trust
Current Estimated Value
Purchase Details
Closed on
Jun 27, 2013
Sold by
Macdonald Kathryn Sonia
Bought by
Walker Debra S
Purchase Details
Closed on
Dec 14, 2009
Sold by
Macdonald Kathryn Sonia
Bought by
Pferschy Charisse and Robinson Sonia Marie
Purchase Details
Closed on
Nov 1, 2005
Sold by
Frady Steven R and Frady Jackie L
Bought by
Macdonald Kathryn Sonia
Home Financials for this Owner
Home Financials are based on the most recent Mortgage that was taken out on this home.
Original Mortgage
$341,600
Interest Rate
5.37%
Mortgage Type
Purchase Money Mortgage
Create a Home Valuation Report for This Property
The Home Valuation Report is an in-depth analysis detailing your home's value as well as a comparison with similar homes in the area
Home Values in the Area
Average Home Value in this Area
Purchase History
| Date | Buyer | Sale Price | Title Company |
|---|---|---|---|
| Walker Engstrom 2009 Trust | -- | None Available | |
| Walker Debra S | $250,000 | Ticor Title | |
| Pferschy Charisse | -- | None Available | |
| Macdonald Kathryn Sonia | $427,000 | Stewart Title Of Northern Nv |
Source: Public Records
Mortgage History
| Date | Status | Borrower | Loan Amount |
|---|---|---|---|
| Previous Owner | Macdonald Kathryn Sonia | $341,600 |
Source: Public Records
Tax History Compared to Growth
Tax History
| Year | Tax Paid | Tax Assessment Tax Assessment Total Assessment is a certain percentage of the fair market value that is determined by local assessors to be the total taxable value of land and additions on the property. | Land | Improvement |
|---|---|---|---|---|
| 2025 | $2,035 | $84,622 | $50,610 | $34,012 |
| 2024 | $2,035 | $82,727 | $47,425 | $35,302 |
| 2023 | $1,923 | $80,396 | $47,495 | $32,901 |
| 2022 | $1,868 | $71,221 | $43,120 | $28,101 |
| 2021 | $1,813 | $58,114 | $29,470 | $28,644 |
| 2020 | $1,759 | $59,278 | $29,925 | $29,353 |
| 2019 | $1,708 | $56,873 | $27,930 | $28,943 |
| 2018 | $1,658 | $49,623 | $20,720 | $28,903 |
| 2017 | $1,610 | $49,534 | $20,055 | $29,479 |
| 2016 | $1,570 | $50,288 | $19,670 | $30,618 |
| 2015 | $1,568 | $46,496 | $15,400 | $31,096 |
| 2014 | $1,523 | $43,448 | $12,985 | $30,463 |
| 2013 | -- | $40,167 | $9,765 | $30,402 |
Source: Public Records
Map
Nearby Homes
- 4899 Cool Springs Dr
- 4875 Golden Springs Dr
- 2012 Branch Ln Unit 2012B
- 795 Twin Pines Ct
- 2108 Chicory Way Unit 2108A
- 5495 Talbot Ln Unit 40-880-14
- 4740 Plumas St
- 718 W Pleasant Oak Trail
- 4970 Plumas St
- 4900 Plumas St Unit A113
- 1545 Golf Club Dr
- 1545 Golf Club Dr Unit 4
- 6109 S Pleasant Oak Trail
- 1533 Golf Club Dr Unit Hilltop 7
- 957 Leah Cir
- 4811 Lakeridge Terrace W
- 6114 Triple Crown Dr
- 4947 Lakeridge Terrace W
- 1509 Golf Club Dr Unit Hilltop 13
- 4833 Lakeridge Terrace W
- 4885 Cool Springs Dr
- 4932 Meadow Springs Dr
- 4912 Meadow Springs Dr
- 4952 Meadow Springs Dr
- 4875 Cool Springs Dr
- 4890 Cool Springs Dr
- 4892 Meadow Springs Dr
- 4880 Cool Springs Dr
- 4898 Cool Springs Dr
- 4870 Cool Springs Dr
- 4865 Cool Springs Dr
- 942 Brook Springs Dr
- 4872 Meadow Springs Dr Unit 2
- 932 Brook Springs Dr
- 4992 Meadow Springs Dr
- 922 Brook Springs Dr
- 4860 Cool Springs Dr
- 4875 Warren Way
- 4931 Meadow Springs Dr
- 4865 Warren Way