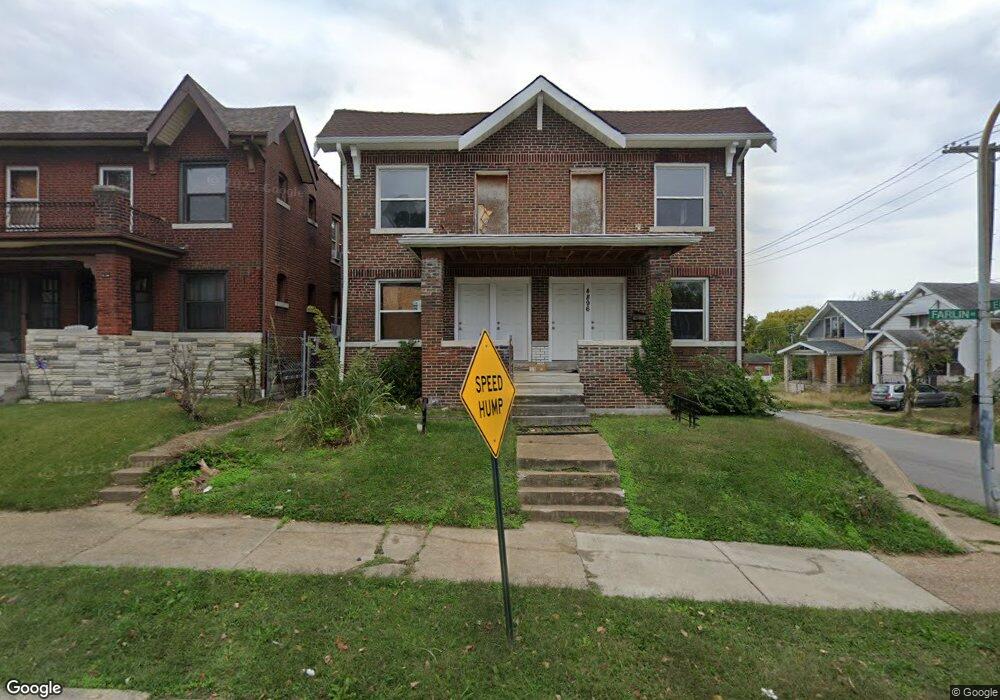
4896 Farlin Ave Saint Louis, MO 63115
Penrose NeighborhoodEstimated Value: $82,000 - $130,000
--
Bed
4
Baths
3,542
Sq Ft
$31/Sq Ft
Est. Value
About This Home
This home is located at 4896 Farlin Ave, Saint Louis, MO 63115 and is currently estimated at $109,333, approximately $30 per square foot. 4896 Farlin Ave is a home located in St. Louis City with nearby schools including Hickey Elementary School, Sumner High School, and North Side Community Elementary School.
Ownership History
Date
Name
Owned For
Owner Type
Purchase Details
Closed on
May 31, 2019
Sold by
Land Reutilization Authority Of City Of
Bought by
Bass Charles
Current Estimated Value
Purchase Details
Closed on
Aug 29, 2018
Sold by
Hsbc Bank Usa
Bought by
Land Reutilization Authority Of The City
Purchase Details
Closed on
Jun 30, 2016
Sold by
Jones Juaneice
Bought by
Hsbc Bank Usa National Association
Purchase Details
Closed on
Feb 18, 2002
Sold by
Slaughter Annette
Bought by
Jones Juaneice
Purchase Details
Closed on
Feb 14, 2002
Sold by
Middlewest Properties Inc
Bought by
Slaughter Annette
Purchase Details
Closed on
Sep 12, 2001
Sold by
Murphy James W
Bought by
Middlewest Properties Inc
Purchase Details
Closed on
Oct 28, 1999
Sold by
Lewis Hezekiah
Bought by
Golden Delta Enterprises
Create a Home Valuation Report for This Property
The Home Valuation Report is an in-depth analysis detailing your home's value as well as a comparison with similar homes in the area
Home Values in the Area
Average Home Value in this Area
Purchase History
| Date | Buyer | Sale Price | Title Company |
|---|---|---|---|
| Bass Charles | $2,800 | None Available | |
| Land Reutilization Authority Of The City | -- | None Available | |
| Hsbc Bank Usa National Association | $11,750 | None Available | |
| Jones Juaneice | -- | -- | |
| Slaughter Annette | -- | -- | |
| Middlewest Properties Inc | $10,500 | -- | |
| Golden Delta Enterprises | $35,000 | -- |
Source: Public Records
Tax History Compared to Growth
Tax History
| Year | Tax Paid | Tax Assessment Tax Assessment Total Assessment is a certain percentage of the fair market value that is determined by local assessors to be the total taxable value of land and additions on the property. | Land | Improvement |
|---|---|---|---|---|
| 2025 | $247 | $2,710 | $590 | $2,120 |
| 2024 | $237 | $2,620 | $590 | $2,030 |
| 2023 | $237 | $2,620 | $590 | $2,030 |
| 2022 | $242 | $2,590 | $590 | $2,000 |
| 2021 | $242 | $2,590 | $590 | $2,000 |
| 2020 | $240 | $2,590 | $590 | $2,000 |
| 2019 | $0 | $2,590 | $590 | $2,000 |
| 2018 | $0 | $2,470 | $590 | $1,880 |
| 2017 | $232 | $2,470 | $590 | $1,880 |
| 2016 | $331 | $3,610 | $1,100 | $2,510 |
| 2015 | $302 | $3,610 | $1,100 | $2,510 |
| 2014 | $306 | $3,610 | $1,100 | $2,510 |
| 2013 | -- | $3,670 | $1,100 | $2,570 |
Source: Public Records
Map
Nearby Homes
- 3937-3939 N Euclid Ave
- 4874 Margaretta Ave
- 4881 San Francisco Ave
- 4903 San Francisco Ave
- 4920 San Francisco Ave
- 4823 San Francisco Ave
- 5426 N Euclid Ave
- 5483 N Euclid Ave
- 5429 N Euclid Ave
- 5437 N Euclid Ave
- 4843 Lee Ave
- 4707 Farlin Ave
- 4713-4715 Natural Bridge Ave
- 4681 Kossuth Ave
- 3332 Aubert Ave
- 4629 Farlin Ave
- 4848 Calvin Ave
- 4718 Lexington Ave
- 4655 Lee Ave
- 4830 Ashland Ave
- 4892 Farlin Ave
- 4888 Farlin Ave
- 4884 Farlin Ave
- 4015 N Euclid Ave
- 4017 N Euclid Ave
- 4011 N Euclid Ave
- 4023 N Euclid Ave
- 4895 Margaretta Ave
- 4893 Margaretta Ave
- 4005 N Euclid Ave
- 4891 Margaretta Ave
- 4007 N Euclid Ave
- 4882 Farlin Ave
- 4889 Margaretta Ave
- 4887 Margaretta Ave
- 4880 Farlin Ave
- 4899 Farlin Ave
- 4895 Farlin Ave
- 4893 Farlin Ave
- 4883 Margaretta Ave