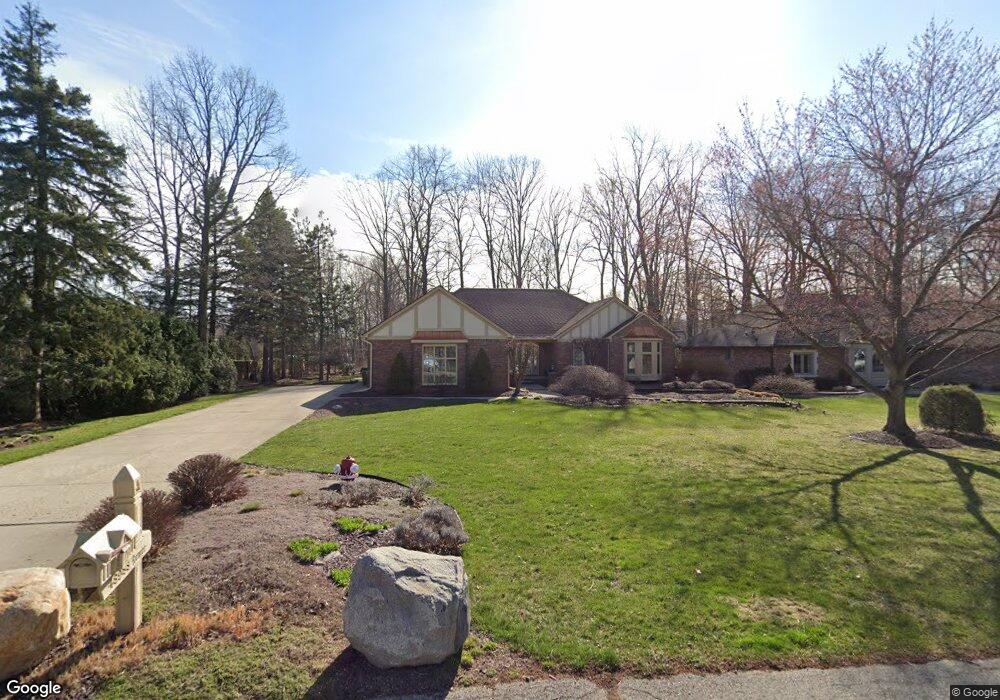
48988 Remer Ave Shelby Township, MI 48317
Estimated Value: $400,000 - $490,000
3
Beds
3
Baths
2,171
Sq Ft
$208/Sq Ft
Est. Value
About This Home
This home is located at 48988 Remer Ave, Shelby Township, MI 48317 and is currently estimated at $451,097, approximately $207 per square foot. 48988 Remer Ave is a home located in Macomb County with nearby schools including Wiley Elementary School, Eppler Junior High School, and Utica High School.
Ownership History
Date
Name
Owned For
Owner Type
Purchase Details
Closed on
Mar 13, 2025
Sold by
Paul F Nagengast Jr Revocable Trust and Nagengast Lynn Marie
Bought by
Nagengast Lynn Marie
Current Estimated Value
Purchase Details
Closed on
Nov 15, 2013
Sold by
Nagengast Paul F and Nagengast Lynn Marie
Bought by
Nagengast Paul F and The Paul F Nagengast Jr Living
Purchase Details
Closed on
Mar 28, 2013
Sold by
Nagengast Paul F and Nagengast Paul F
Bought by
Nagengast Paul F and Nagengast Lynn Marie
Home Financials for this Owner
Home Financials are based on the most recent Mortgage that was taken out on this home.
Original Mortgage
$164,000
Interest Rate
3.38%
Mortgage Type
New Conventional
Purchase Details
Closed on
Feb 17, 2010
Sold by
Nagengast Paul F
Bought by
Paul F Nagengast Jr Living Trust and Nagengast
Purchase Details
Closed on
Jun 22, 1999
Sold by
Sandalo Maria
Bought by
Nagengast Linda S
Create a Home Valuation Report for This Property
The Home Valuation Report is an in-depth analysis detailing your home's value as well as a comparison with similar homes in the area
Home Values in the Area
Average Home Value in this Area
Purchase History
| Date | Buyer | Sale Price | Title Company |
|---|---|---|---|
| Nagengast Lynn Marie | -- | None Listed On Document | |
| Nagengast Paul F | -- | None Available | |
| Nagengast Paul F | -- | Sue Fisher Land Title Agency | |
| Paul F Nagengast Jr Living Trust | -- | None Listed On Document | |
| Nagengast Linda S | $225,000 | -- |
Source: Public Records
Mortgage History
| Date | Status | Borrower | Loan Amount |
|---|---|---|---|
| Previous Owner | Nagengast Paul F | $164,000 |
Source: Public Records
Tax History Compared to Growth
Tax History
| Year | Tax Paid | Tax Assessment Tax Assessment Total Assessment is a certain percentage of the fair market value that is determined by local assessors to be the total taxable value of land and additions on the property. | Land | Improvement |
|---|---|---|---|---|
| 2025 | $4,568 | $213,200 | $0 | $0 |
| 2024 | $2,704 | $207,000 | $0 | $0 |
| 2023 | $2,561 | $170,800 | $0 | $0 |
| 2022 | $4,131 | $145,100 | $0 | $0 |
| 2021 | $4,018 | $142,800 | $0 | $0 |
| 2020 | $2,357 | $139,400 | $0 | $0 |
| 2019 | $3,679 | $143,000 | $0 | $0 |
| 2018 | $3,634 | $143,400 | $0 | $0 |
| 2017 | $3,569 | $146,400 | $34,900 | $111,500 |
| 2016 | $3,543 | $146,400 | $0 | $0 |
| 2015 | $3,492 | $138,050 | $0 | $0 |
| 2012 | -- | $0 | $0 | $0 |
Source: Public Records
Map
Nearby Homes
- 49051 Hidden Woods Ln Unit 1
- 49225 W Woods Dr Unit 20
- 49207 W Woods Dr Unit 25
- 49090 Driftwood Dr
- 48037 Remer Ave
- 48325 Red Oak Dr
- 8311 Rhode Dr
- 8693 Hedgeway Dr
- 8751 Speedway Dr
- 49280 Wildwood Ct
- 12214 Anthony Dr
- 8139 Hedgeway Dr
- 9039 Oakridge Trail
- 48200 Burton Dr
- 49466 Nicholette
- 12430 Conservation Trail Unit 337
- 49385 E Central Park Unit 25
- 8527 Walnut Hill
- 7223 N Central Park
- 50021 Ludwig Ct
- 48960 Remer Ave
- 48965 Hidden Oaks Ln
- 48932 Remer Ave
- 11189 Mapleridge
- 49010 White Mill Dr
- 9073 Shelby Woods Dr
- 48933 Hidden Oaks Ln
- 9074 Shelby Woods Dr
- 49022 White Mill Dr
- 11211 Mapleridge
- 49071 Hidden Woods Ln Unit 2
- 9051 Shelby Woods Dr
- 49011 White Mill Dr
- 48911 Hidden Oaks Ln
- 48876 Lansdowne Ct
- 48889 Remer Ave
- 48876 Remer Ave
- 9025 Shelby Woods Dr
- 49036 White Mill Dr
- 48934 Hidden Oaks Ln