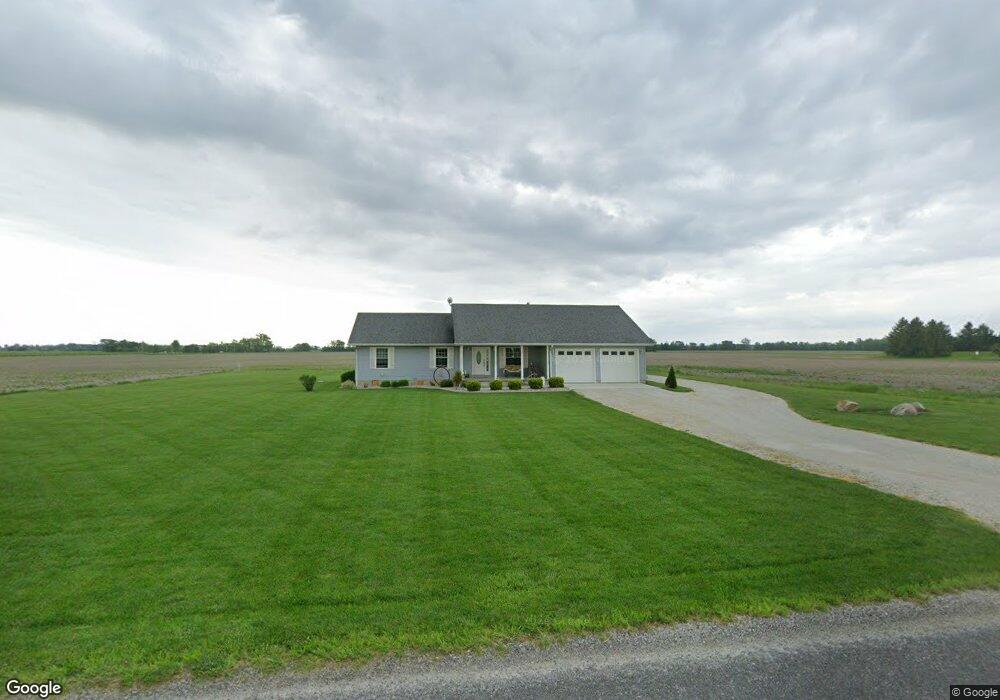
4899 N Martin Williston Rd Martin, OH 43445
Estimated Value: $305,000 - $394,000
3
Beds
3
Baths
1,612
Sq Ft
$211/Sq Ft
Est. Value
About This Home
This home is located at 4899 N Martin Williston Rd, Martin, OH 43445 and is currently estimated at $340,417, approximately $211 per square foot. 4899 N Martin Williston Rd is a home located in Ottawa County with nearby schools including Genoa Elementary School.
Ownership History
Date
Name
Owned For
Owner Type
Purchase Details
Closed on
Jul 16, 2019
Sold by
Bury Christopher A and Estate Of Carol R Bury
Bought by
Shaw Robert and Shaw Suzanne
Current Estimated Value
Home Financials for this Owner
Home Financials are based on the most recent Mortgage that was taken out on this home.
Original Mortgage
$149,600
Outstanding Balance
$131,063
Interest Rate
3.82%
Mortgage Type
New Conventional
Estimated Equity
$209,354
Purchase Details
Closed on
Jun 21, 2007
Sold by
Bury Carol R and Bury Christopher A
Bought by
Bury Carol R
Home Financials for this Owner
Home Financials are based on the most recent Mortgage that was taken out on this home.
Original Mortgage
$253,500
Interest Rate
6.26%
Mortgage Type
Reverse Mortgage Home Equity Conversion Mortgage
Purchase Details
Closed on
Nov 7, 2005
Sold by
Bury Carol R
Bought by
Bury Et Al Christopher A
Create a Home Valuation Report for This Property
The Home Valuation Report is an in-depth analysis detailing your home's value as well as a comparison with similar homes in the area
Home Values in the Area
Average Home Value in this Area
Purchase History
| Date | Buyer | Sale Price | Title Company |
|---|---|---|---|
| Shaw Robert | $187,000 | None Available | |
| Bury Carol R | -- | Attorney | |
| Bury Et Al Christopher A | -- | -- |
Source: Public Records
Mortgage History
| Date | Status | Borrower | Loan Amount |
|---|---|---|---|
| Open | Shaw Robert | $149,600 | |
| Previous Owner | Bury Carol R | $253,500 |
Source: Public Records
Tax History Compared to Growth
Tax History
| Year | Tax Paid | Tax Assessment Tax Assessment Total Assessment is a certain percentage of the fair market value that is determined by local assessors to be the total taxable value of land and additions on the property. | Land | Improvement |
|---|---|---|---|---|
| 2024 | $4,113 | $92,768 | $12,810 | $79,958 |
| 2023 | $4,113 | $72,804 | $11,141 | $61,663 |
| 2022 | $3,731 | $72,804 | $11,141 | $61,663 |
| 2021 | $3,292 | $72,800 | $11,140 | $61,660 |
| 2020 | $3,167 | $66,660 | $7,680 | $58,980 |
| 2019 | $2,044 | $53,150 | $7,680 | $45,470 |
| 2018 | $1,968 | $53,150 | $7,680 | $45,470 |
| 2017 | $1,776 | $46,290 | $6,980 | $39,310 |
| 2016 | $1,782 | $46,290 | $6,980 | $39,310 |
| 2015 | $1,793 | $46,290 | $6,980 | $39,310 |
| 2014 | $1,552 | $44,320 | $6,980 | $37,340 |
| 2013 | $1,557 | $44,320 | $6,980 | $37,340 |
Source: Public Records
Map
Nearby Homes
- 0 W Walbridge Rd
- Track 1 W Walbridge Rd
- 19367 W Walbridge Rd
- 21224 W Toledo St
- 6927 N Wildacre Rd
- 1861 N Opfer-Lentz Rd
- 24181 W James Ridge Rd
- 23105 W Edgefield Dr
- 1615 N Thyre Dr
- 23225 Ohio 51
- 23430 State Route 51 W
- 7105 N Elliston Trowbridge Rd
- 7330 Jerusalem Rd
- 445 S Yondota Rd
- 22771 W Holt Harrigan Rd
- 1301 West St
- 0 N Graytown Rd
- 207 E 11th St
- 1350 N Genoa Clay Center Rd
- 29118 Millbury Rd
- 4979 N Martin Williston Rd
- 5292 N Martin Williston Rd
- 5012 N Martin Williston Rd
- 4725 N Martin Williston Rd
- 4720 N Martin Williston Rd
- 4683 N Martin Williston Rd
- 4650 N Martin Williston Rd
- 21274 W Walbridge East Rd
- 20679 W Walbridge East Rd
- 4562 N Martin Williston Rd
- 21324 W Walbridge East Rd
- 19114 W Walbridge Rd
- 19180 W Walbridge Rd
- 4 W Walbridge Rd
- 5 W Walbridge Rd
- 6 W Walbridge Rd
- 1 W Walbridge Rd
- 2 W Walbridge Rd
- 3 W Walbridge Rd
- 4580 N Martin Williston Rd