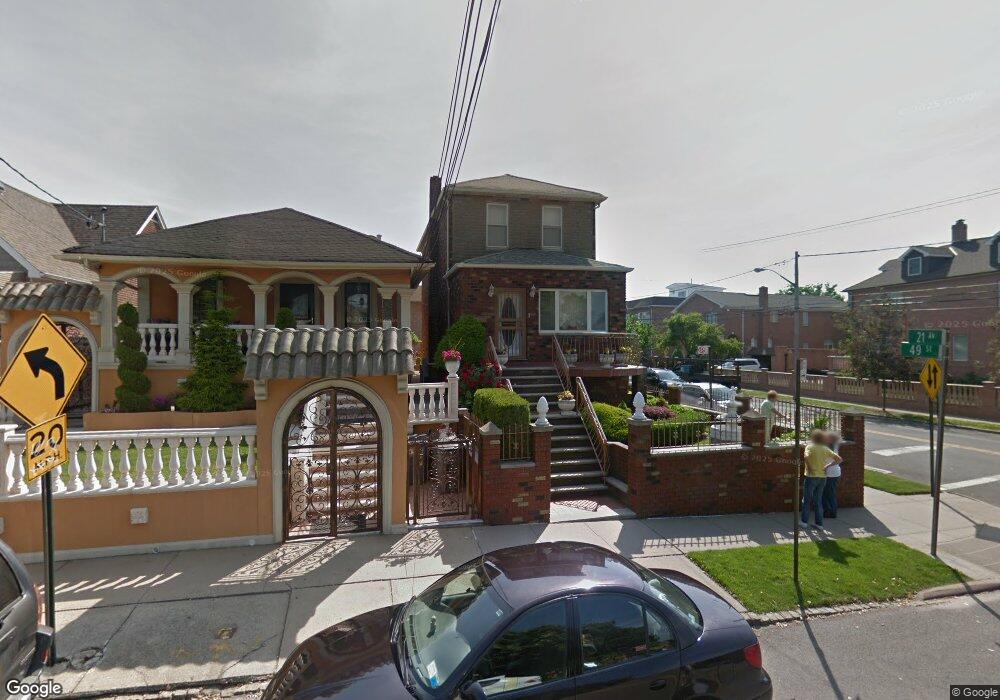
49-02 21st Ave East Elmhurst, NY 11370
Ditmars Steinway NeighborhoodEstimated Value: $1,032,000 - $1,099,000
3
Beds
2
Baths
1,024
Sq Ft
$1,026/Sq Ft
Est. Value
About This Home
This home is located at 49-02 21st Ave, East Elmhurst, NY 11370 and is currently estimated at $1,051,136, approximately $1,026 per square foot. 49-02 21st Ave is a home located in Queens County with nearby schools including P.S. 2 Alfred Zimberg, Is 141 The Steinway, and William Cullen Bryant High School.
Ownership History
Date
Name
Owned For
Owner Type
Purchase Details
Closed on
Apr 13, 2021
Sold by
Katragis Nicholas
Bought by
49-02 21St Ave Llc
Current Estimated Value
Purchase Details
Closed on
Sep 26, 2019
Sold by
Sorrento Calogero and Sorrento Maria A
Bought by
Katragis Nicholas
Home Financials for this Owner
Home Financials are based on the most recent Mortgage that was taken out on this home.
Original Mortgage
$690,000
Interest Rate
3.6%
Create a Home Valuation Report for This Property
The Home Valuation Report is an in-depth analysis detailing your home's value as well as a comparison with similar homes in the area
Home Values in the Area
Average Home Value in this Area
Purchase History
| Date | Buyer | Sale Price | Title Company |
|---|---|---|---|
| 49-02 21St Ave Llc | -- | -- | |
| Katragis Nicholas | $990,000 | -- |
Source: Public Records
Mortgage History
| Date | Status | Borrower | Loan Amount |
|---|---|---|---|
| Previous Owner | Katragis Nicholas | $690,000 |
Source: Public Records
Tax History Compared to Growth
Tax History
| Year | Tax Paid | Tax Assessment Tax Assessment Total Assessment is a certain percentage of the fair market value that is determined by local assessors to be the total taxable value of land and additions on the property. | Land | Improvement |
|---|---|---|---|---|
| 2025 | $5,814 | $29,238 | $5,463 | $23,775 |
| 2024 | $5,814 | $28,949 | $5,080 | $23,869 |
| 2023 | $5,490 | $27,336 | $4,849 | $22,487 |
| 2022 | $5,149 | $69,660 | $11,760 | $57,900 |
| 2021 | $5,128 | $62,220 | $11,760 | $50,460 |
| 2020 | $5,157 | $56,400 | $11,760 | $44,640 |
| 2019 | $4,754 | $55,380 | $11,760 | $43,620 |
| 2018 | $4,346 | $22,780 | $4,138 | $18,642 |
| 2017 | $4,082 | $21,496 | $4,661 | $16,835 |
| 2016 | $3,749 | $21,496 | $4,661 | $16,835 |
| 2015 | $2,226 | $20,304 | $7,904 | $12,400 |
| 2014 | $2,226 | $20,104 | $9,385 | $10,719 |
Source: Public Records
Map
Nearby Homes
- 21-38 73rd St
- 2144 73rd St
- 20-50 Hazen St
- 2134 74th St
- 70-11 Ditmars Blvd
- 2151 48th St
- 20-39 49th St
- 70-07 Ditmars Blvd
- 21-20 47th St
- 22-26 74th St
- 47-18 Ditmars Blvd
- 2036 47th St
- 2230 75th St
- 22-39 74th St
- 2208 76th St Unit A3
- 2064 46th St
- 21-16 77 Street 2nd Floor
- 22-31 47th St
- 2233 47th St
- 2209 76th St Unit C2