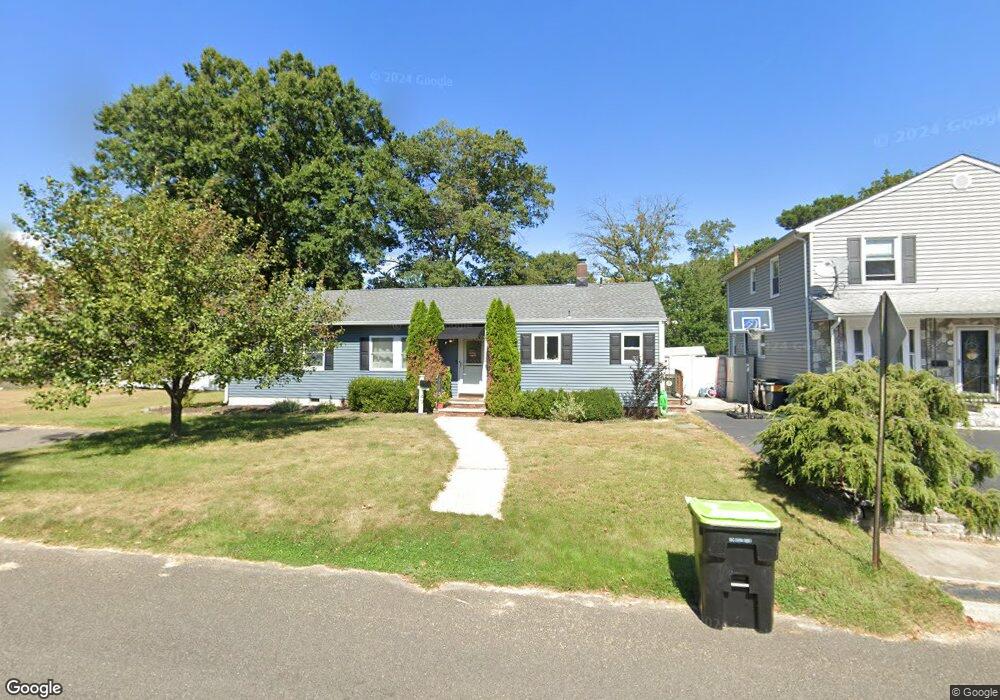
49 2nd St Keansburg, NJ 07734
Estimated Value: $400,944 - $460,000
3
Beds
1
Bath
1,007
Sq Ft
$418/Sq Ft
Est. Value
About This Home
This home is located at 49 2nd St, Keansburg, NJ 07734 and is currently estimated at $420,736, approximately $417 per square foot. 49 2nd St is a home located in Monmouth County with nearby schools including Raritan High School, Baytul-Iman Academy, and St. Ann School.
Ownership History
Date
Name
Owned For
Owner Type
Purchase Details
Closed on
Nov 19, 2021
Sold by
Waitt Mark D
Bought by
Waitt Mark D and Waitt Caitlin
Current Estimated Value
Home Financials for this Owner
Home Financials are based on the most recent Mortgage that was taken out on this home.
Original Mortgage
$210,000
Interest Rate
3.22%
Mortgage Type
New Conventional
Purchase Details
Closed on
Oct 21, 2011
Sold by
Tapp Anna
Bought by
Waitt Mark D
Home Financials for this Owner
Home Financials are based on the most recent Mortgage that was taken out on this home.
Original Mortgage
$173,487
Interest Rate
4.11%
Mortgage Type
FHA
Create a Home Valuation Report for This Property
The Home Valuation Report is an in-depth analysis detailing your home's value as well as a comparison with similar homes in the area
Home Values in the Area
Average Home Value in this Area
Purchase History
| Date | Buyer | Sale Price | Title Company |
|---|---|---|---|
| Waitt Mark D | -- | Rosenberg Pllc | |
| Waitt Mark D | $178,000 | Red Bank Title Agency Inc |
Source: Public Records
Mortgage History
| Date | Status | Borrower | Loan Amount |
|---|---|---|---|
| Previous Owner | Waitt Mark D | $210,000 | |
| Previous Owner | Waitt Mark D | $173,487 |
Source: Public Records
Tax History Compared to Growth
Tax History
| Year | Tax Paid | Tax Assessment Tax Assessment Total Assessment is a certain percentage of the fair market value that is determined by local assessors to be the total taxable value of land and additions on the property. | Land | Improvement |
|---|---|---|---|---|
| 2025 | $6,881 | $394,500 | $257,500 | $137,000 |
| 2024 | $6,738 | $327,200 | $223,500 | $103,700 |
| 2023 | $6,738 | $315,300 | $212,500 | $102,800 |
| 2022 | $6,156 | $261,500 | $171,000 | $90,500 |
| 2021 | $6,156 | $240,000 | $159,500 | $80,500 |
| 2020 | $6,047 | $234,200 | $155,500 | $78,700 |
| 2019 | $5,789 | $220,700 | $142,500 | $78,200 |
| 2018 | $5,610 | $212,100 | $137,500 | $74,600 |
| 2017 | $5,335 | $201,700 | $129,200 | $72,500 |
| 2016 | $5,267 | $199,900 | $129,200 | $70,700 |
| 2015 | $5,206 | $198,100 | $129,200 | $68,900 |
| 2014 | $4,853 | $173,200 | $107,500 | $65,700 |
Source: Public Records
Map
Nearby Homes