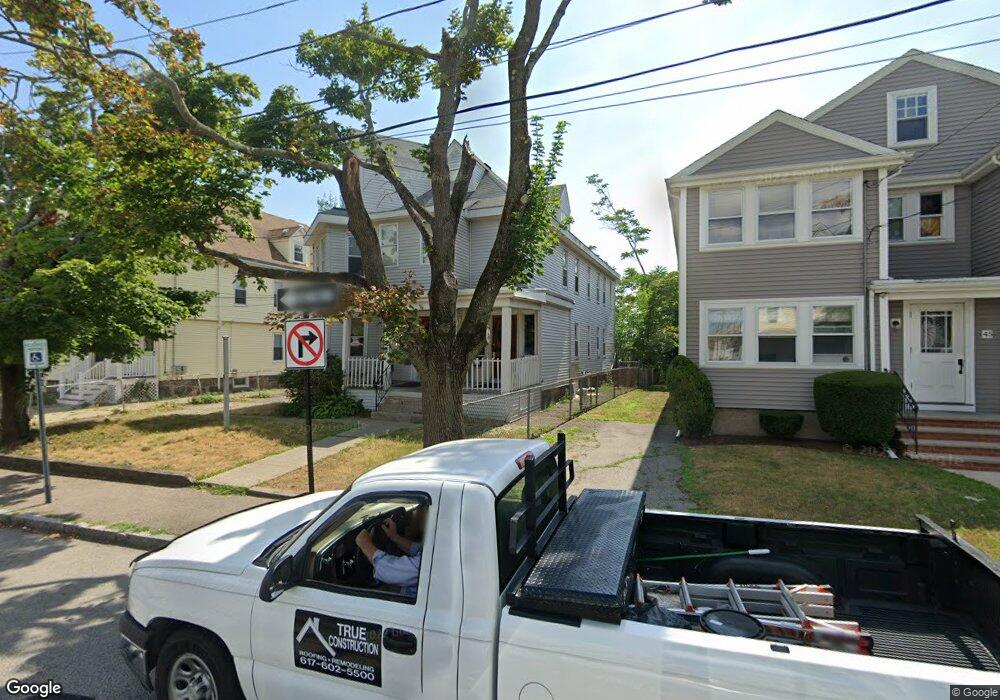
49-51 Holmes St 2d Quincy, MA 02171
Montclair NeighborhoodEstimated Value: $1,504,811
1
Bed
1
Bath
100
Sq Ft
$15,048/Sq Ft
Est. Value
About This Home
This home is located at 49-51 Holmes St 2d, Quincy, MA 02171 and is currently priced at $1,504,811, approximately $15,048 per square foot. 49-51 Holmes St 2d is a home located in Norfolk County with nearby schools including Montclair Elementary School, Atlantic Middle School, and North Quincy High School.
Ownership History
Date
Name
Owned For
Owner Type
Purchase Details
Closed on
Dec 7, 2017
Sold by
Dig 1 Llc
Bought by
North Quincy Inn Llc
Current Estimated Value
Home Financials for this Owner
Home Financials are based on the most recent Mortgage that was taken out on this home.
Original Mortgage
$655,000
Outstanding Balance
$551,453
Interest Rate
3.94%
Mortgage Type
Unknown
Purchase Details
Closed on
Oct 1, 2008
Sold by
South Coastal Bk
Bought by
Dig 1 Llc
Create a Home Valuation Report for This Property
The Home Valuation Report is an in-depth analysis detailing your home's value as well as a comparison with similar homes in the area
Home Values in the Area
Average Home Value in this Area
Purchase History
| Date | Buyer | Sale Price | Title Company |
|---|---|---|---|
| North Quincy Inn Llc | $1,080,000 | -- | |
| Dig 1 Llc | $525,000 | -- |
Source: Public Records
Mortgage History
| Date | Status | Borrower | Loan Amount |
|---|---|---|---|
| Open | North Quincy Inn Llc | $655,000 |
Source: Public Records
Tax History
| Year | Tax Paid | Tax Assessment Tax Assessment Total Assessment is a certain percentage of the fair market value that is determined by local assessors to be the total taxable value of land and additions on the property. | Land | Improvement |
|---|---|---|---|---|
| 2025 | $14,208 | $1,232,300 | $373,100 | $859,200 |
| 2024 | $12,965 | $1,150,400 | $373,100 | $777,300 |
| 2023 | $10,796 | $970,000 | $355,300 | $614,700 |
| 2022 | $10,116 | $844,400 | $309,000 | $535,400 |
| 2021 | $10,023 | $825,600 | $294,200 | $531,400 |
| 2020 | $9,796 | $788,100 | $294,200 | $493,900 |
| 2019 | $9,759 | $777,600 | $275,000 | $502,600 |
| 2018 | $11,114 | $833,100 | $254,600 | $578,500 |
| 2017 | $10,147 | $716,100 | $242,500 | $473,600 |
| 2016 | $9,715 | $676,500 | $210,900 | $465,600 |
| 2015 | $9,096 | $623,000 | $191,700 | $431,300 |
| 2014 | $9,123 | $613,900 | $182,600 | $431,300 |
Source: Public Records
Map
Nearby Homes
- 17 Holmes St Unit 2
- 17 Holmes St Unit 1
- 39 Fayette St Unit 403
- 98 Safford St
- 85 E Squantum St Unit 10
- 52 Hamilton Ave
- 20 Ellington Rd
- 10 Weston Ave Unit 322
- 154 N Central Ave
- 28 Apthorp St
- 70 Walnut St
- 201 Billings St
- 43 Hilma St
- 133 Commander Shea Blvd Unit 502
- 133 Commander Shea Blvd Unit 203
- 133 Commander Shea Blvd Unit 709
- 297 Billings St
- 90 Quincy Shore Dr Unit 701
- 90 Quincy Shore Dr Unit 501
- 175 Quincy Shore Dr Unit B24
- 49 Holmes St Unit 3A
- 49 Holmes St Unit 2B
- 49 Holmes St Unit 3B
- 49 Holmes St Unit 3C
- 49 Holmes St Unit 3D
- 49 Holmes St Unit 1D
- 49 Holmes St
- 49 Holmes St Unit 51
- 45 Holmes St Unit 4
- 45 Holmes St Unit 3
- 45 Holmes St Unit 1
- 45 Holmes St
- 53 Holmes St
- 55 Holmes St Unit 55
- 53 Holmes St Unit 53
- 41 Holmes St
- 59 Holmes St
- 39 Holmes St Unit 39
- 39 Holmes St Unit 1
- 39 Holmes St
Your Personal Tour Guide
Ask me questions while you tour the home.