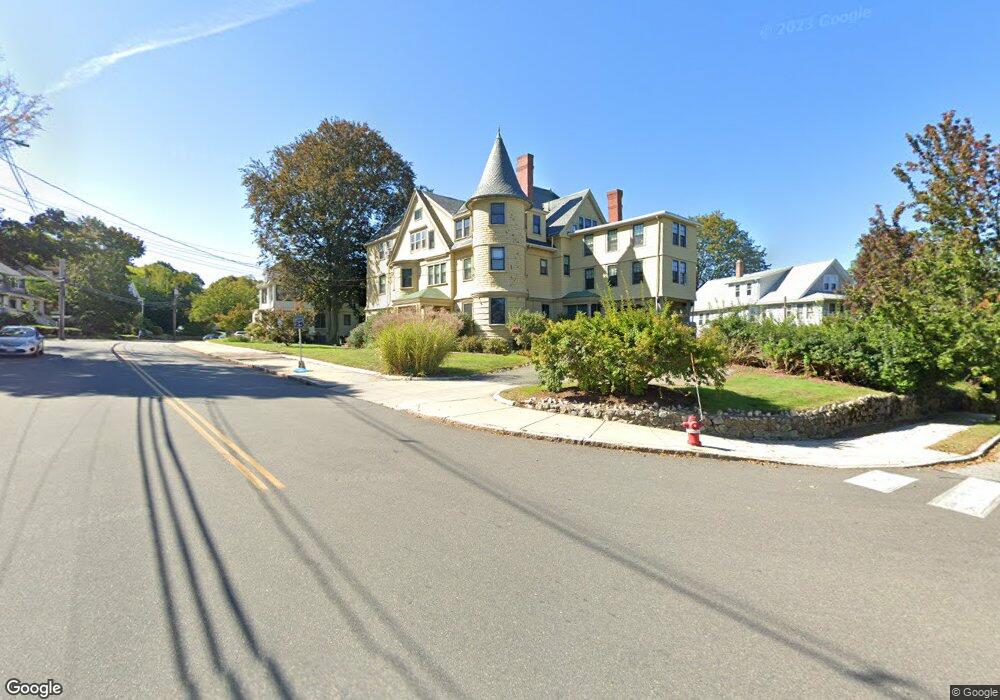
49-53 Appleton St Unit 4 Arlington, MA 02476
Arlington Heights NeighborhoodEstimated Value: $412,738 - $530,000
1
Bed
1
Bath
637
Sq Ft
$710/Sq Ft
Est. Value
About This Home
This home is located at 49-53 Appleton St Unit 4, Arlington, MA 02476 and is currently estimated at $452,435, approximately $710 per square foot. 49-53 Appleton St Unit 4 is a home located in Middlesex County with nearby schools including Peirce Elementary School, Dallin Elementary School, and Ottoson Middle School.
Ownership History
Date
Name
Owned For
Owner Type
Purchase Details
Closed on
May 16, 2017
Sold by
Mead Kristin L
Bought by
Vecchione Laura
Current Estimated Value
Purchase Details
Closed on
Jul 14, 2006
Sold by
Scully Lauren
Bought by
Mead Kristin L
Home Financials for this Owner
Home Financials are based on the most recent Mortgage that was taken out on this home.
Original Mortgage
$197,600
Interest Rate
6.71%
Mortgage Type
Purchase Money Mortgage
Purchase Details
Closed on
Jun 21, 2001
Sold by
Perkins Joan E
Bought by
Scully Lauren
Home Financials for this Owner
Home Financials are based on the most recent Mortgage that was taken out on this home.
Original Mortgage
$180,000
Interest Rate
7.09%
Mortgage Type
Purchase Money Mortgage
Purchase Details
Closed on
Oct 20, 1997
Sold by
Idahurst Rt and Rose Sanford
Bought by
Perkins Joan E
Home Financials for this Owner
Home Financials are based on the most recent Mortgage that was taken out on this home.
Original Mortgage
$99,920
Interest Rate
7.46%
Mortgage Type
Purchase Money Mortgage
Create a Home Valuation Report for This Property
The Home Valuation Report is an in-depth analysis detailing your home's value as well as a comparison with similar homes in the area
Home Values in the Area
Average Home Value in this Area
Purchase History
| Date | Buyer | Sale Price | Title Company |
|---|---|---|---|
| Vecchione Laura | $310,000 | -- | |
| Mead Kristin L | $247,000 | -- | |
| Scully Lauren | $225,000 | -- | |
| Perkins Joan E | $124,900 | -- |
Source: Public Records
Mortgage History
| Date | Status | Borrower | Loan Amount |
|---|---|---|---|
| Previous Owner | Perkins Joan E | $220,000 | |
| Previous Owner | Mead Kristin L | $197,600 | |
| Previous Owner | Perkins Joan E | $180,000 | |
| Previous Owner | Perkins Joan E | $99,920 |
Source: Public Records
Tax History
| Year | Tax Paid | Tax Assessment Tax Assessment Total Assessment is a certain percentage of the fair market value that is determined by local assessors to be the total taxable value of land and additions on the property. | Land | Improvement |
|---|---|---|---|---|
| 2025 | $3,840 | $356,500 | $0 | $356,500 |
| 2024 | $3,345 | $315,900 | $0 | $315,900 |
| 2023 | $3,404 | $303,700 | $0 | $303,700 |
| 2022 | $3,379 | $295,900 | $0 | $295,900 |
| 2021 | $3,266 | $288,000 | $0 | $288,000 |
| 2020 | $3,142 | $284,100 | $0 | $284,100 |
| 2019 | $3,022 | $268,400 | $0 | $268,400 |
| 2018 | $2,898 | $238,900 | $0 | $238,900 |
| 2017 | $2,295 | $182,700 | $0 | $182,700 |
| 2016 | $2,208 | $172,500 | $0 | $172,500 |
| 2015 | $2,299 | $169,700 | $0 | $169,700 |
Source: Public Records
Map
Nearby Homes
- 11 Lowell St Unit B
- 33 Harvard St
- 39 Forest St Unit 39A
- 4 Beck Rd
- 7 Park Avenue Extension
- 74 Quincy St
- 7 Bow St
- 15 Higgins St Unit 17
- 455 Summer St Unit 455
- 455-457 Summer St
- 8 Old Colony Ln Unit 2
- 303 Gray St
- 74 Wollaston Ave
- 15 Laurel St Unit 3
- 6 Brattle St Unit 6
- 25 Walnut Terrace
- 1025 Massachusetts Ave Unit 404
- 1025 Massachusetts Ave Unit 204
- 1025 Massachusetts Ave Unit 304
- 1025 Massachusetts Ave Unit 211
- 53 Appleon St Unit 3
- 49 Appleton St Unit B
- 49 Appleton St Unit A
- 49 Appleton St Unit 11
- 49 Appleton St Unit 10
- 49 Appleton St Unit 9
- 49 Appleton St Unit 8
- 49 Appleton St Unit 7
- 49 Appleton St Unit 6
- 49 Appleton St Unit 5
- 49 Appleton St Unit 4
- 49 Appleton St Unit 3
- 49 Appleton St Unit 2
- 49 Appleton St Unit 1
- 53 Appleton St Unit I
- 49 Appleton St Unit 11,49
- 53 Appleton St Unit 2
- 53 Appleton St Unit 4
- 53 Appleton St Unit 3
- 51 Appleton St Unit 8
Your Personal Tour Guide
Ask me questions while you tour the home.