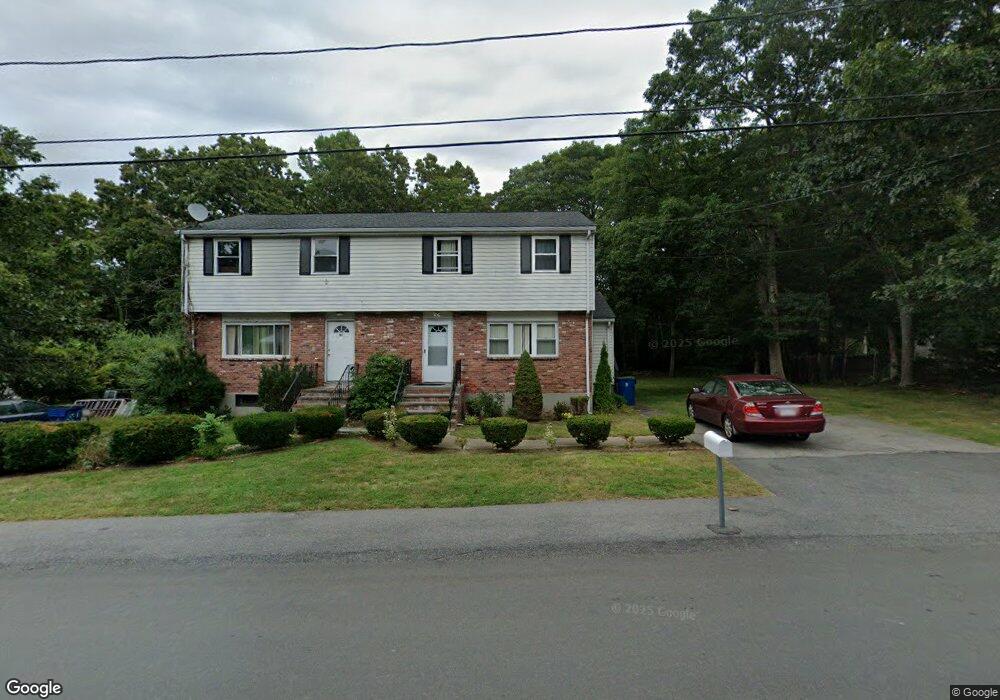
49 Acorn Dr Randolph, MA 02368
South Randolph NeighborhoodEstimated Value: $402,000 - $538,000
3
Beds
2
Baths
1,314
Sq Ft
$356/Sq Ft
Est. Value
About This Home
This home is located at 49 Acorn Dr, Randolph, MA 02368 and is currently estimated at $467,886, approximately $356 per square foot. 49 Acorn Dr is a home located in Norfolk County with nearby schools including Randolph High School and Lighthouse Baptist Christian Academy.
Ownership History
Date
Name
Owned For
Owner Type
Purchase Details
Closed on
Jun 21, 2002
Sold by
Nwachukwu Priscilla I
Bought by
Garcia Rony J and Garcia Nancy V
Current Estimated Value
Home Financials for this Owner
Home Financials are based on the most recent Mortgage that was taken out on this home.
Original Mortgage
$206,600
Outstanding Balance
$87,355
Interest Rate
6.81%
Mortgage Type
Purchase Money Mortgage
Estimated Equity
$380,531
Purchase Details
Closed on
Sep 29, 1993
Sold by
Leavey Kenneth C and Leavey Teresa A
Bought by
Nwachukwu Priscilla I
Create a Home Valuation Report for This Property
The Home Valuation Report is an in-depth analysis detailing your home's value as well as a comparison with similar homes in the area
Home Values in the Area
Average Home Value in this Area
Purchase History
| Date | Buyer | Sale Price | Title Company |
|---|---|---|---|
| Garcia Rony J | $217,500 | -- | |
| Garcia Rony J | $217,500 | -- | |
| Nwachukwu Priscilla I | $92,000 | -- |
Source: Public Records
Mortgage History
| Date | Status | Borrower | Loan Amount |
|---|---|---|---|
| Open | Garcia Rony J | $206,600 | |
| Closed | Nwachukwu Priscilla I | $206,600 | |
| Previous Owner | Nwachukwu Priscilla I | $25,000 | |
| Previous Owner | Nwachukwu Priscilla I | $101,500 |
Source: Public Records
Tax History Compared to Growth
Tax History
| Year | Tax Paid | Tax Assessment Tax Assessment Total Assessment is a certain percentage of the fair market value that is determined by local assessors to be the total taxable value of land and additions on the property. | Land | Improvement |
|---|---|---|---|---|
| 2025 | $4,084 | $351,800 | $0 | $351,800 |
| 2024 | $4,115 | $359,400 | $0 | $359,400 |
| 2023 | $3,764 | $311,600 | $0 | $311,600 |
| 2022 | $3,649 | $268,300 | $0 | $268,300 |
| 2021 | $3,457 | $233,900 | $0 | $233,900 |
| 2020 | $3,355 | $225,000 | $0 | $225,000 |
| 2019 | $3,270 | $218,300 | $0 | $218,300 |
| 2018 | $3,263 | $205,500 | $0 | $205,500 |
| 2017 | $3,175 | $196,200 | $0 | $196,200 |
| 2016 | $3,085 | $177,400 | $0 | $177,400 |
| 2015 | $3,021 | $166,900 | $0 | $166,900 |
Source: Public Records
Map
Nearby Homes