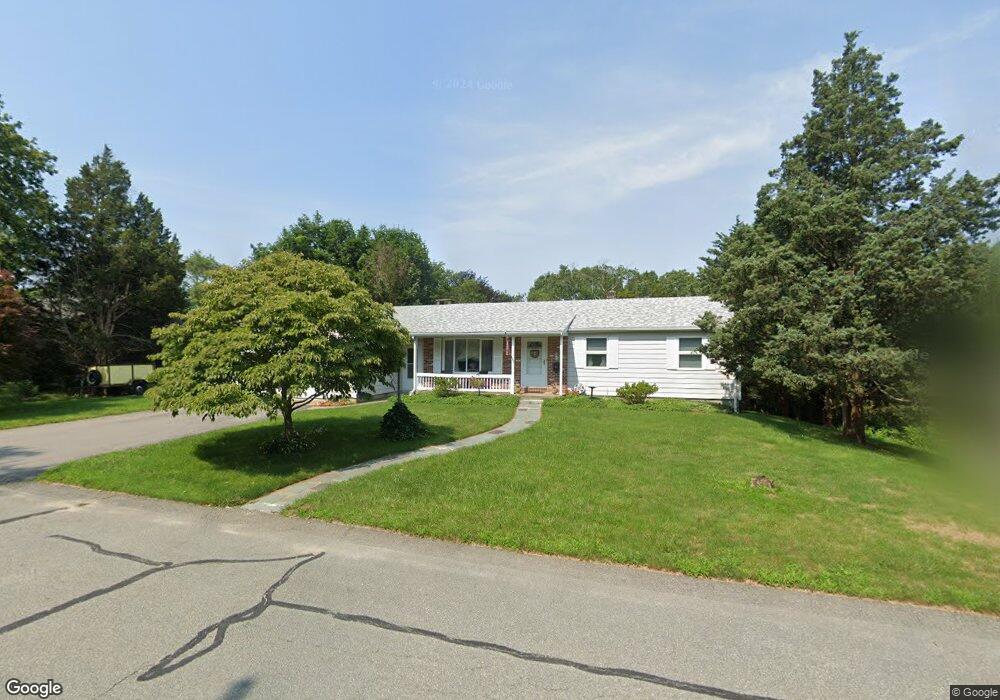
49 Allen Blvd Swansea, MA 02777
South Swansea NeighborhoodEstimated Value: $434,000 - $489,752
3
Beds
2
Baths
1,352
Sq Ft
$340/Sq Ft
Est. Value
About This Home
This home is located at 49 Allen Blvd, Swansea, MA 02777 and is currently estimated at $459,938, approximately $340 per square foot. 49 Allen Blvd is a home located in Bristol County with nearby schools including Joseph Case High School and Swansea Wood School.
Ownership History
Date
Name
Owned For
Owner Type
Purchase Details
Closed on
Apr 10, 2003
Sold by
Kenyon Ft and Kenyon Lloyd E
Bought by
Monte Albert P and Monte Karen P
Current Estimated Value
Purchase Details
Closed on
Jan 31, 1991
Sold by
Cabral Antonio and Goodrow Rita
Bought by
Kenyon Lloyid E and Kenyon Shirley
Create a Home Valuation Report for This Property
The Home Valuation Report is an in-depth analysis detailing your home's value as well as a comparison with similar homes in the area
Home Values in the Area
Average Home Value in this Area
Purchase History
| Date | Buyer | Sale Price | Title Company |
|---|---|---|---|
| Monte Albert P | $189,000 | -- | |
| Kenyon Lloyid E | $45,000 | -- |
Source: Public Records
Mortgage History
| Date | Status | Borrower | Loan Amount |
|---|---|---|---|
| Previous Owner | Kenyon Lloyid E | $70,000 | |
| Previous Owner | Kenyon Lloyid E | $70,000 |
Source: Public Records
Tax History Compared to Growth
Tax History
| Year | Tax Paid | Tax Assessment Tax Assessment Total Assessment is a certain percentage of the fair market value that is determined by local assessors to be the total taxable value of land and additions on the property. | Land | Improvement |
|---|---|---|---|---|
| 2025 | $5,185 | $435,000 | $160,000 | $275,000 |
| 2024 | $5,168 | $431,000 | $160,000 | $271,000 |
| 2023 | $5,008 | $381,400 | $119,500 | $261,900 |
| 2022 | $4,541 | $339,400 | $103,900 | $235,500 |
| 2021 | $4,541 | $290,500 | $105,000 | $185,500 |
| 2020 | $4,708 | $302,200 | $109,500 | $192,700 |
| 2019 | $4,372 | $281,900 | $94,300 | $187,600 |
| 2018 | $4,179 | $273,500 | $91,500 | $182,000 |
| 2017 | $3,579 | $269,500 | $87,500 | $182,000 |
| 2016 | $3,307 | $244,600 | $68,700 | $175,900 |
| 2015 | $3,011 | $229,300 | $68,700 | $160,600 |
| 2014 | $2,967 | $231,100 | $68,700 | $162,400 |
Source: Public Records
Map
Nearby Homes
- 196 Coolidge St
- 19 Richard Rd
- 41 James Ave
- 19 Keller Ave
- 20 Sherbourne Ave
- 153 Puffer Ave
- 105 Birchwood Dr
- 159 Wilder St
- 127 Sheraton Ave
- 30 Front St
- 24 Front St
- 25 Inverness Rd
- 502 Ocean Grove Ave
- 675 Lees River Ave
- 167 Mercier Ave
- 34 Columbia Rd
- 123 Calef Ave
- 0 Hortonville Rd Unit 73242268
- 79 Cedar Ave
- 132 Jackson Ave