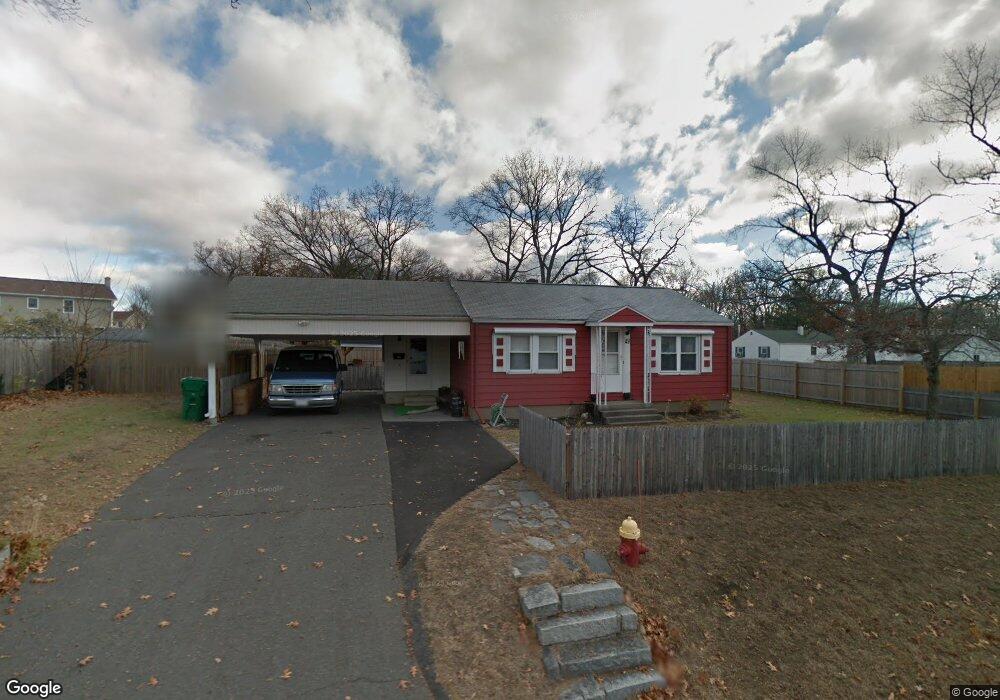
49 Allen St Chicopee, MA 01020
Fairview NeighborhoodEstimated Value: $227,000 - $296,000
2
Beds
1
Bath
720
Sq Ft
$353/Sq Ft
Est. Value
About This Home
This home is located at 49 Allen St, Chicopee, MA 01020 and is currently estimated at $254,091, approximately $352 per square foot. 49 Allen St is a home located in Hampden County with nearby schools including Streiber Elementary School, Fairview Middle School, and Chicopee Comprehensive High School.
Ownership History
Date
Name
Owned For
Owner Type
Purchase Details
Closed on
Sep 17, 2021
Sold by
Dygon Steven D
Bought by
Dygon Steven D and Dygon Kerri A
Current Estimated Value
Purchase Details
Closed on
May 18, 2012
Sold by
Bogart Helen M
Bought by
Dygon Steven D
Create a Home Valuation Report for This Property
The Home Valuation Report is an in-depth analysis detailing your home's value as well as a comparison with similar homes in the area
Home Values in the Area
Average Home Value in this Area
Purchase History
| Date | Buyer | Sale Price | Title Company |
|---|---|---|---|
| Dygon Steven D | -- | None Available | |
| Dygon Steven D | $80,000 | -- | |
| Dygon Steven D | $80,000 | -- | |
| Dygon Steven D | $80,000 | -- |
Source: Public Records
Mortgage History
| Date | Status | Borrower | Loan Amount |
|---|---|---|---|
| Closed | Dygon Steven D | $0 |
Source: Public Records
Tax History Compared to Growth
Tax History
| Year | Tax Paid | Tax Assessment Tax Assessment Total Assessment is a certain percentage of the fair market value that is determined by local assessors to be the total taxable value of land and additions on the property. | Land | Improvement |
|---|---|---|---|---|
| 2025 | $2,990 | $197,200 | $104,800 | $92,400 |
| 2024 | $2,840 | $192,400 | $102,700 | $89,700 |
| 2023 | $2,636 | $174,000 | $93,300 | $80,700 |
| 2022 | $2,526 | $148,700 | $81,200 | $67,500 |
| 2021 | $2,425 | $137,700 | $73,800 | $63,900 |
| 2020 | $2,364 | $135,400 | $75,800 | $59,600 |
| 2019 | $2,356 | $131,200 | $75,800 | $55,400 |
| 2018 | $2,296 | $125,400 | $72,200 | $53,200 |
| 2017 | $2,172 | $125,500 | $67,300 | $58,200 |
| 2016 | $2,053 | $121,400 | $67,300 | $54,100 |
| 2015 | $2,250 | $128,300 | $67,300 | $61,000 |
| 2014 | $1,125 | $128,300 | $67,300 | $61,000 |
Source: Public Records
Map
Nearby Homes
- 442 Prospect St
- 523 James St
- 55 Dowds Ln
- 134 Lukasik St
- 39 Mccarthy Ave
- 180 Fletcher Cir
- 81 Mccarthy Ave
- 340 Pendleton Ave
- 15 Hudson Ave
- 341 Montcalm St
- 162 Pendleton Ave
- 88 Prospect St
- 143 Royal St
- 5 Marion St
- 37 Greenwood Terrace
- 17 Yorktown Ct
- 47 N Canal St
- 35 Ludlow Rd
- 41 Susan Ave
- 15 Riverview Place