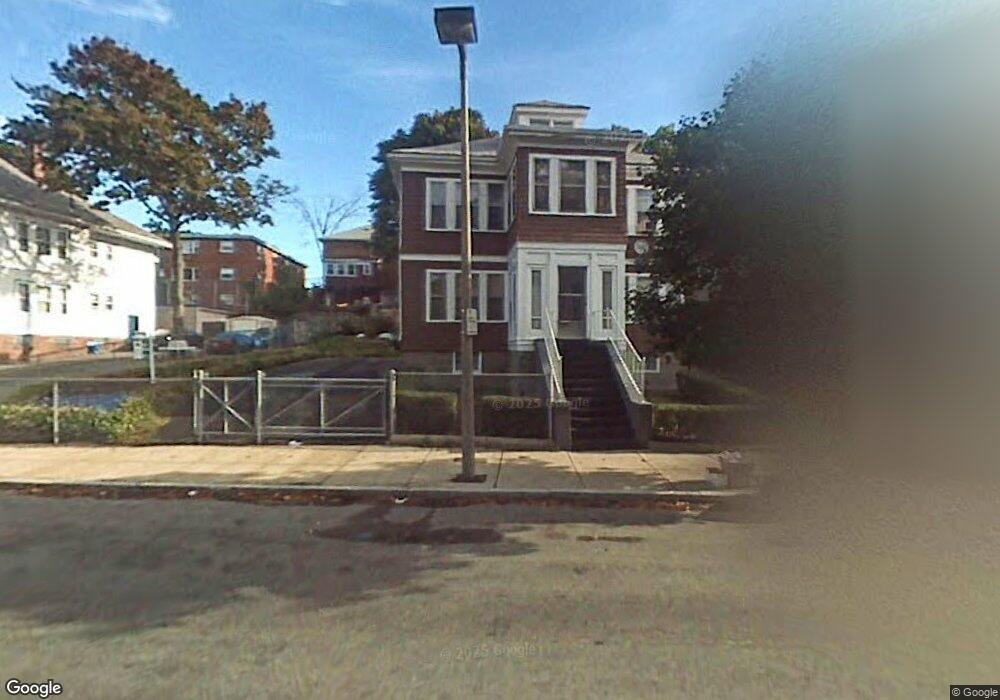
49 Almont St Mattapan, MA 02126
Wellington Hill NeighborhoodEstimated Value: $712,000 - $1,040,000
6
Beds
5
Baths
3,665
Sq Ft
$237/Sq Ft
Est. Value
About This Home
This home is located at 49 Almont St, Mattapan, MA 02126 and is currently estimated at $867,019, approximately $236 per square foot. 49 Almont St is a home located in Suffolk County with nearby schools including KIPP Academy Boston Charter School and Berea Seventh-day Adventist Academy.
Ownership History
Date
Name
Owned For
Owner Type
Purchase Details
Closed on
Sep 12, 2014
Sold by
Wornum Taylor and Wornum Eva M
Bought by
Hagood Regina D and Wornum Robert T
Current Estimated Value
Home Financials for this Owner
Home Financials are based on the most recent Mortgage that was taken out on this home.
Original Mortgage
$320,000
Outstanding Balance
$105,435
Interest Rate
4.12%
Mortgage Type
New Conventional
Estimated Equity
$761,584
Purchase Details
Closed on
Jan 7, 2002
Sold by
Boston City Of
Bought by
Northington W E and Northington L C
Create a Home Valuation Report for This Property
The Home Valuation Report is an in-depth analysis detailing your home's value as well as a comparison with similar homes in the area
Home Values in the Area
Average Home Value in this Area
Purchase History
| Date | Buyer | Sale Price | Title Company |
|---|---|---|---|
| Hagood Regina D | $400,000 | -- | |
| Northington W E | $2,500 | -- |
Source: Public Records
Mortgage History
| Date | Status | Borrower | Loan Amount |
|---|---|---|---|
| Open | Hagood Regina D | $320,000 |
Source: Public Records
Tax History Compared to Growth
Tax History
| Year | Tax Paid | Tax Assessment Tax Assessment Total Assessment is a certain percentage of the fair market value that is determined by local assessors to be the total taxable value of land and additions on the property. | Land | Improvement |
|---|---|---|---|---|
| 2025 | $8,855 | $764,700 | $252,100 | $512,600 |
| 2024 | $7,795 | $715,100 | $219,200 | $495,900 |
| 2023 | $7,178 | $668,300 | $204,800 | $463,500 |
| 2022 | $6,859 | $630,400 | $193,200 | $437,200 |
| 2021 | $6,228 | $583,700 | $178,900 | $404,800 |
| 2020 | $6,099 | $577,600 | $191,400 | $386,200 |
| 2019 | $5,403 | $512,600 | $145,100 | $367,500 |
| 2018 | $4,884 | $466,000 | $145,100 | $320,900 |
| 2017 | $4,935 | $466,000 | $145,100 | $320,900 |
| 2016 | $4,417 | $401,500 | $145,100 | $256,400 |
| 2015 | $4,209 | $347,600 | $114,100 | $233,500 |
| 2014 | $3,785 | $300,900 | $114,100 | $186,800 |
Source: Public Records
Map
Nearby Homes
- 35 Almont St
- 116 Almont St
- 20 Monterey Ave
- 60 and 64 Monterey Ave
- 49 Fottler Rd
- 45 1st Ave Unit 111
- 710 Walk Hill St
- 100 Itasca St
- 1465 Blue Hill Ave
- 22 Babson St
- 637 Walk Hill St
- 14-14R Kennebec St
- 567B Norfolk St
- 95 Woodhaven St
- 4 Crossman St Unit 4
- 11 French St
- 31 Evelyn St
- 98 Babson St
- 10 Brockton St
- 770 Cummins Hwy Unit 1