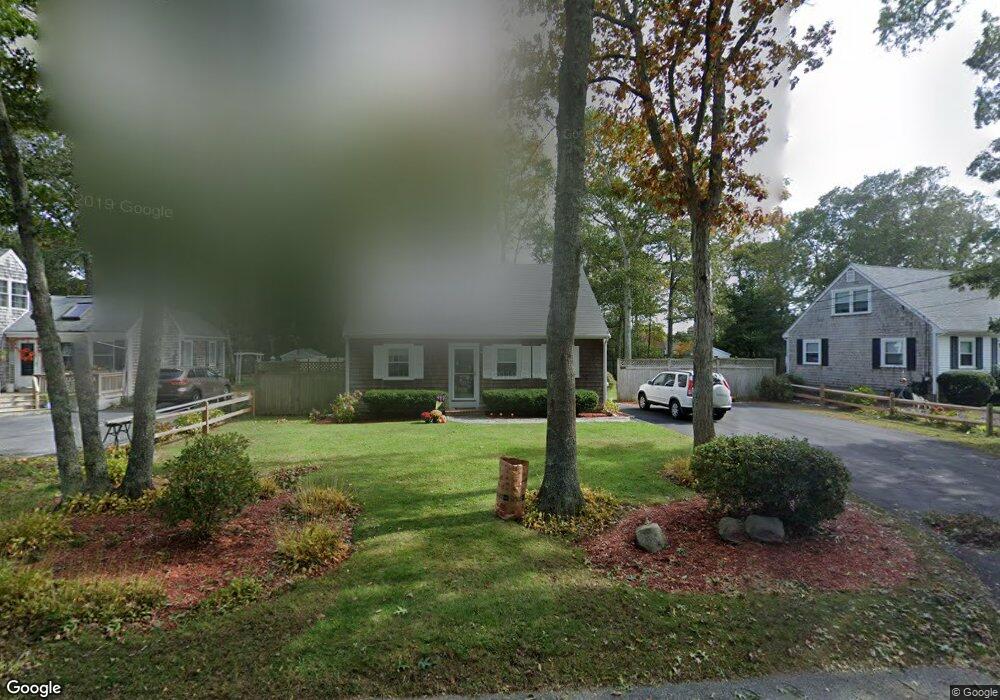
49 Andrews St East Falmouth, MA 02536
Estimated Value: $503,926 - $579,000
4
Beds
1
Bath
1,200
Sq Ft
$449/Sq Ft
Est. Value
About This Home
This home is located at 49 Andrews St, East Falmouth, MA 02536 and is currently estimated at $538,482, approximately $448 per square foot. 49 Andrews St is a home located in Barnstable County with nearby schools including Teaticket Elementary School, Morse Pond School, and Lawrence School.
Ownership History
Date
Name
Owned For
Owner Type
Purchase Details
Closed on
Oct 12, 2012
Sold by
Coughlin David and Coughlin Caitlin M
Bought by
Puro Erica K and Puro Marika J
Current Estimated Value
Home Financials for this Owner
Home Financials are based on the most recent Mortgage that was taken out on this home.
Original Mortgage
$178,400
Outstanding Balance
$124,001
Interest Rate
3.59%
Mortgage Type
New Conventional
Estimated Equity
$414,481
Purchase Details
Closed on
Mar 18, 2010
Sold by
Howard Anna E
Bought by
Coughlin David and Coughlin Caitlin M
Home Financials for this Owner
Home Financials are based on the most recent Mortgage that was taken out on this home.
Original Mortgage
$204,232
Interest Rate
5.05%
Mortgage Type
Purchase Money Mortgage
Create a Home Valuation Report for This Property
The Home Valuation Report is an in-depth analysis detailing your home's value as well as a comparison with similar homes in the area
Home Values in the Area
Average Home Value in this Area
Purchase History
| Date | Buyer | Sale Price | Title Company |
|---|---|---|---|
| Puro Erica K | $223,000 | -- | |
| Puro Erica K | $223,000 | -- | |
| Coughlin David | $208,000 | -- | |
| Coughlin David | $208,000 | -- |
Source: Public Records
Mortgage History
| Date | Status | Borrower | Loan Amount |
|---|---|---|---|
| Open | Puro Erica K | $178,400 | |
| Closed | Coughlin David | $178,400 | |
| Previous Owner | Coughlin David | $204,232 |
Source: Public Records
Tax History Compared to Growth
Tax History
| Year | Tax Paid | Tax Assessment Tax Assessment Total Assessment is a certain percentage of the fair market value that is determined by local assessors to be the total taxable value of land and additions on the property. | Land | Improvement |
|---|---|---|---|---|
| 2025 | $2,403 | $409,300 | $157,700 | $251,600 |
| 2024 | $2,337 | $372,100 | $142,600 | $229,500 |
| 2023 | $2,243 | $324,200 | $142,600 | $181,600 |
| 2022 | $1,894 | $235,300 | $89,800 | $145,500 |
| 2021 | $1,810 | $212,900 | $85,900 | $127,000 |
| 2020 | $1,762 | $205,100 | $78,100 | $127,000 |
| 2019 | $1,728 | $201,900 | $78,100 | $123,800 |
| 2018 | $1,667 | $193,800 | $78,100 | $115,700 |
| 2017 | $1,624 | $190,400 | $78,100 | $112,300 |
| 2016 | $1,545 | $184,600 | $78,100 | $106,500 |
| 2015 | $1,512 | $184,600 | $78,100 | $106,500 |
| 2014 | $1,531 | $187,800 | $82,000 | $105,800 |
Source: Public Records
Map
Nearby Homes
- 14 Sharon Dr
- 35 Old Barnstable Rd
- 67 Vidal Ave
- 25 Mill Pond Way
- 33 John Parker Rd
- 20 Veronica Ln
- 14 Old Meeting House Rd
- 25 Mill Farm Way Unit 25
- 25 Mill Farm Way
- 22 Mill Farm Way Unit 22
- 22 Mill Farm Way Unit 2
- 86 Bonito Ave
- 44 Oxbow Rd
- 66 Braxton Rd
- 45 Green Pond Rd
- 16 Annette Ave
- 25 Harris Hill Rd
- 27 Emerald Ln
- 33 Chilmark Dr Unit 33
- 49 Andrews St
- 45 Andrews St
- 53 Andrews St
- 126 Old Barnstable Rd
- 43 Andrews St
- 57 Andrews St
- 122 Old Barnstable Rd
- 130 Old Barnstable Rd
- 50 Andrews St
- 118 Old Barnstable Rd
- 54 Andrews St
- 37 Andrews St
- 134 Old Barnstable Rd
- 61 Andrews St
- 42 Andrews St
- 114 Old Barnstable Rd
- 60 Andrews St
- 63 Andrews St
- 33 Andrews St
- 46 Andrews St