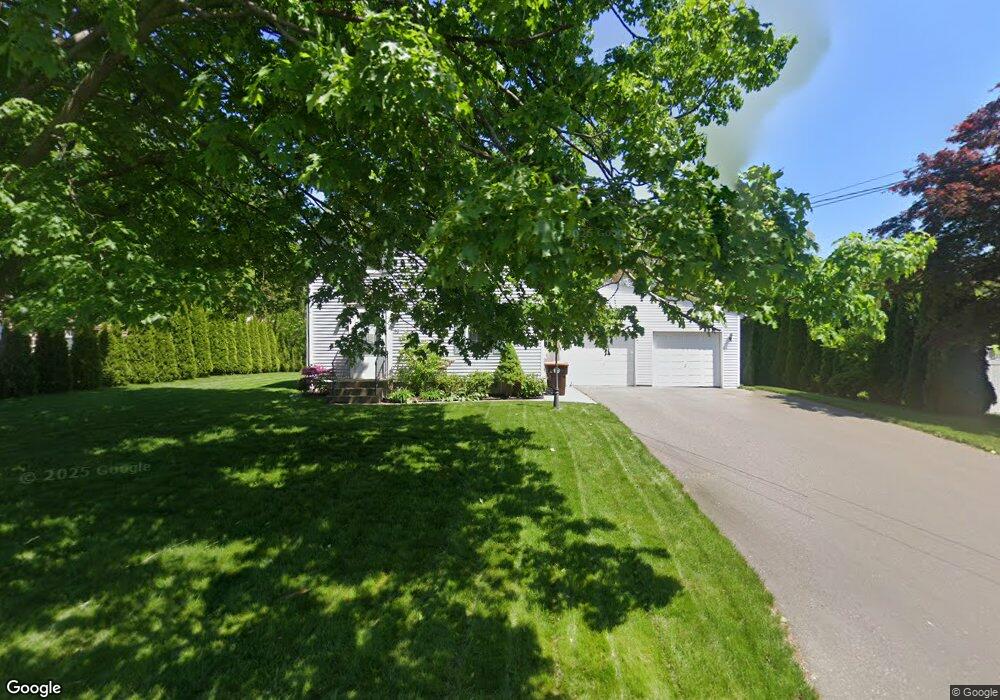
49 Anthony St Agawam, MA 01001
Estimated Value: $305,390 - $392,000
3
Beds
2
Baths
1,100
Sq Ft
$303/Sq Ft
Est. Value
About This Home
This home is located at 49 Anthony St, Agawam, MA 01001 and is currently estimated at $332,848, approximately $302 per square foot. 49 Anthony St is a home located in Hampden County with nearby schools including Agawam Junior High School, Agawam High School, and St Thomas The Apostle School.
Ownership History
Date
Name
Owned For
Owner Type
Purchase Details
Closed on
Oct 31, 2008
Sold by
Connor Ann T
Bought by
Bennett Darren A
Current Estimated Value
Home Financials for this Owner
Home Financials are based on the most recent Mortgage that was taken out on this home.
Original Mortgage
$140,000
Outstanding Balance
$90,757
Interest Rate
5.83%
Mortgage Type
Purchase Money Mortgage
Estimated Equity
$242,091
Create a Home Valuation Report for This Property
The Home Valuation Report is an in-depth analysis detailing your home's value as well as a comparison with similar homes in the area
Home Values in the Area
Average Home Value in this Area
Purchase History
| Date | Buyer | Sale Price | Title Company |
|---|---|---|---|
| Bennett Darren A | $175,000 | -- |
Source: Public Records
Mortgage History
| Date | Status | Borrower | Loan Amount |
|---|---|---|---|
| Open | Bennett Darren A | $140,000 |
Source: Public Records
Tax History
| Year | Tax Paid | Tax Assessment Tax Assessment Total Assessment is a certain percentage of the fair market value that is determined by local assessors to be the total taxable value of land and additions on the property. | Land | Improvement |
|---|---|---|---|---|
| 2025 | $3,871 | $264,400 | $101,200 | $163,200 |
| 2024 | $3,761 | $258,700 | $101,200 | $157,500 |
| 2023 | $3,413 | $216,300 | $87,600 | $128,700 |
| 2022 | $3,274 | $203,200 | $87,600 | $115,600 |
| 2021 | $3,180 | $189,300 | $77,800 | $111,500 |
| 2020 | $3,115 | $185,100 | $76,600 | $108,500 |
| 2019 | $3,012 | $180,900 | $75,100 | $105,800 |
| 2018 | $2,864 | $172,400 | $75,100 | $97,300 |
| 2017 | $2,740 | $168,000 | $75,100 | $92,900 |
| 2016 | $2,632 | $162,700 | $75,100 | $87,600 |
| 2015 | $2,504 | $159,100 | $75,100 | $84,000 |
Source: Public Records
Map
Nearby Homes
- 42 Anthony St
- 238 Elm St
- 190 Mill St
- 0 Silver St
- 762 Suffield St
- 4H Mapleviewlane Unit 4H
- 88 Country Rd
- 105 Edgewater Rd
- 712 Cooper St
- 86 Willow Brook Dr
- 13 Castle Hills Rd Unit B
- 178 Beekman Dr
- 15 B Castle Hills Rd Unit B
- 70 Reed St
- 57 Reed St
- 25 Damato Way
- 47 Corey Colonial
- 1026 Main St
- 29 Lincoln St
- 1026 Suffield St
Your Personal Tour Guide
Ask me questions while you tour the home.