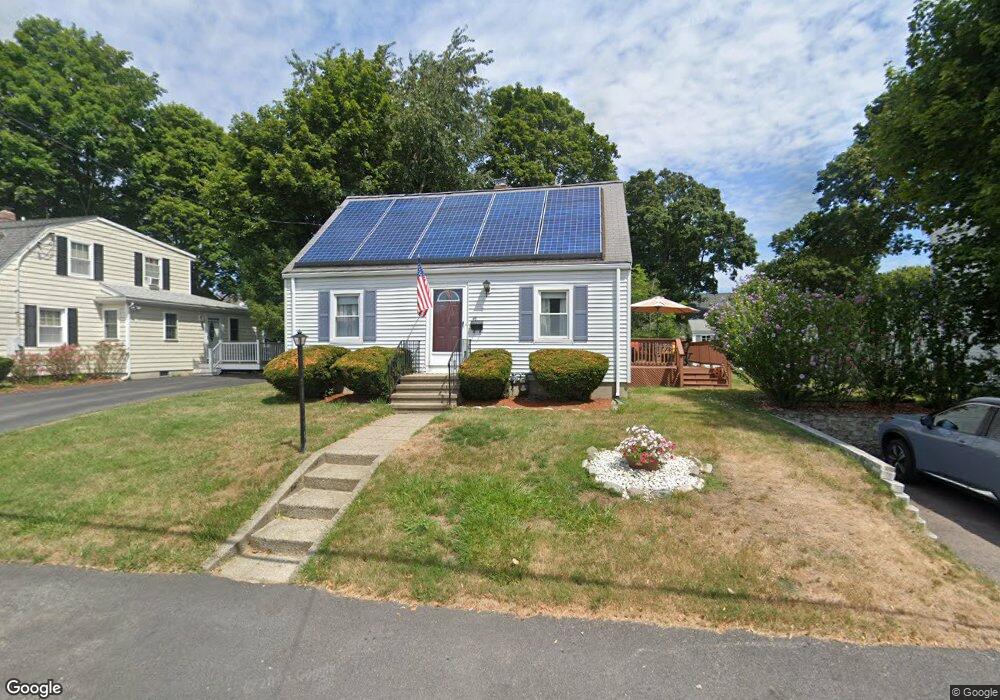
49 Apple Tree Ln Weymouth, MA 02188
Weymouth Landing NeighborhoodEstimated Value: $550,178 - $596,000
3
Beds
1
Bath
1,318
Sq Ft
$439/Sq Ft
Est. Value
About This Home
This home is located at 49 Apple Tree Ln, Weymouth, MA 02188 and is currently estimated at $579,045, approximately $439 per square foot. 49 Apple Tree Ln is a home located in Norfolk County with nearby schools including Frederick C Murphy, Abigail Adams Middle School, and Weymouth Middle School Chapman.
Ownership History
Date
Name
Owned For
Owner Type
Purchase Details
Closed on
Sep 13, 1996
Sold by
Cunningham Joseph Est
Bought by
Carey John F and Carey Susan M
Current Estimated Value
Home Financials for this Owner
Home Financials are based on the most recent Mortgage that was taken out on this home.
Original Mortgage
$106,400
Interest Rate
8.18%
Mortgage Type
Purchase Money Mortgage
Create a Home Valuation Report for This Property
The Home Valuation Report is an in-depth analysis detailing your home's value as well as a comparison with similar homes in the area
Home Values in the Area
Average Home Value in this Area
Purchase History
| Date | Buyer | Sale Price | Title Company |
|---|---|---|---|
| Carey John F | $107,000 | -- |
Source: Public Records
Mortgage History
| Date | Status | Borrower | Loan Amount |
|---|---|---|---|
| Open | Carey John F | $260,000 | |
| Closed | Carey John F | $120,000 | |
| Closed | Carey John F | $106,400 |
Source: Public Records
Tax History
| Year | Tax Paid | Tax Assessment Tax Assessment Total Assessment is a certain percentage of the fair market value that is determined by local assessors to be the total taxable value of land and additions on the property. | Land | Improvement |
|---|---|---|---|---|
| 2025 | $5,010 | $496,000 | $213,600 | $282,400 |
| 2024 | $4,852 | $472,400 | $203,400 | $269,000 |
| 2023 | $4,572 | $437,500 | $188,300 | $249,200 |
| 2022 | $4,463 | $389,400 | $174,400 | $215,000 |
| 2021 | $4,157 | $354,100 | $174,400 | $179,700 |
| 2020 | $3,950 | $331,400 | $174,400 | $157,000 |
| 2019 | $3,854 | $318,000 | $167,700 | $150,300 |
| 2018 | $3,738 | $299,000 | $159,700 | $139,300 |
| 2017 | $3,678 | $287,100 | $152,100 | $135,000 |
| 2016 | $3,592 | $280,600 | $146,300 | $134,300 |
| 2015 | $3,359 | $260,400 | $139,600 | $120,800 |
| 2014 | $3,127 | $235,100 | $129,900 | $105,200 |
Source: Public Records
Map
Nearby Homes
- 107 Summer St
- 82 Lester Ln
- 33 Congress St
- 15 Summer St
- 19 Vine St Unit 3
- 19 Vine St Unit 2
- 11 Richmond St
- 25 Richmond St
- 122 Washington St Unit Twenty-two
- 37 Lantern Ln
- 41 Lantern Ln
- 46 Roosevelt Rd
- 31 Doris Rd
- 501 Commerce Dr Unit 2310
- 501 Commerce Dr Unit 4308
- 116 Greenvale Ave
- 300 Commercial St Unit 23
- 211 Roosevelt Rd
- 747 Middle St
- 8 Tara Dr Unit 4
Your Personal Tour Guide
Ask me questions while you tour the home.